Анализ конкурентов
Инструкции
Основная миссия
Создайте подробный аналитический документ по конкурентной среде для материала А (продукта/компании пользователя).
Конкуренты, подлежащие анализу: материал B, материал C и материал D.
Цель: На основе сравнительного анализа разработать дифференцированные стратегии ценообразования, позиционирования на рынке и маркетинга для материала А.
Перед началом работы уточните у пользователя, какой продукт является для него приоритетным (на чем он сосредоточен) и с какими конкурентами он хочет проводить сравнительный анализ.
Этап 1: Глубокий сбор разведывательной информации (исследование)
Цель: собрать самую актуальную информацию о материале А и выбранных конкурентах в интернете.
Приоритетные направления:
- Основные особенности: значительные обновления за последние 3 месяца.
- Ценовая стратегия: бесплатный и платный уровни, а также корпоративные тарифы, где это возможно.
- Анализ пользовательских настроений: извлечение ключевых тем из Google, Reddit, X (Twitter), отзывов на YouTube и других соответствующих источников отзывов или сообществ; различение положительных и отрицательных сигналов.
- Позиционирование на рынке: как каждая компания позиционирует себя, включая коммуникационную стратегию и целевую аудиторию.
- Каналы сбыта: где и как каждый продукт попадает к покупателям.
Исследовательские действия:
— Используйте поиск в интернете, чтобы найти последние обновления продукта, отзывы и информацию о ценах.
- Изучите веб-сайты конкурентов, страницы с ценами, документацию по функциям и соответствующие общедоступные материалы.
- Извлекать и сравнивать мнения пользователей из обсуждений в сообществах и отзывов на платформах.
- Каждое утверждение, содержащее фактические данные, должно основываться на собранных источниках, и необходимо четко отличать факты от анализа.
Этап 2: Извлечение и анализ структурированных данных
На основе собранной информации организуйте следующие ключевые данные в структурированном документе конкурентного анализа:
Отличительные особенности:
- Свойства, которыми обладают конкуренты, но которых нет у материала А.
- Материал A обладает характеристиками, которых нет у конкурентов.
- Перекрывающиеся характеристики, включая существенные различия в качестве, удобстве использования, реализации или зрелости.
Ценностные предложения:
- Ключевое торговое предложение и уникальное ценностное предложение каждого конкурента.
- Уникальное ценностное предложение материала А и его наиболее сильное конкурентное преимущество.
SWOT-анализ материала А:
- Сильные стороны: в чём материал А превосходит конкурентов.
- Слабые стороны: области, где конкуренты имеют преимущество.
- Возможности: рыночные ниши или уязвимости конкурентов, которые можно использовать.
- Угрозы: действия конкурентов или рыночные тенденции, представляющие риски.
Сравнение маркетингового комплекса 4P:
- Продукт: набор функций, качество и инновации.
- Цена: ценовые категории, восприятие ценности и позиционирование.
- Место: каналы сбыта и охват рынка.
- Продвижение: маркетинговые стратегии, коммуникация и присутствие бренда.
Создайте хорошо структурированный документ по конкурентному анализу, содержащий извлеченные данные, сравнения, примечания к источникам и аналитические выводы. Конечный результат — это только документ; не создавайте слайды или презентации.
Этап 3: Разработка стратегии
На основе проведенного исследования и анализа включите конкретные, практически применимые рекомендации по материалу А в тот же заключительный документ конкурентного анализа.
Рекомендации по ценообразованию:
— Объясните, как материал А использует ценовое прикрепление для эффективной конкуренции.
— Предложите подходящую ценовую архитектуру и позиционирование по уровням, например, высокодоходный средний сегмент, который сможет предложить более низкие цены, чем у конкурентов премиум-класса, при сохранении высокого уровня восприятия качества.
- Выявление ценовых пробелов и возможностей на рынке.
Стратегия продвижения:
- Разрабатывайте маркетинговые сообщения, направленные на выявление существенных слабых сторон конкурентов, не делая при этом необоснованных заявлений.
- Рекомендовать наиболее эффективные каналы и кампании для привлечения клиентов, которые упускают конкуренты.
Стратегия создания контентного барьера:
- Основная идея: выделить уникальную историю бренда или философию дизайна материала А, выходящие за рамки простого перечисления характеристик.
— Четко сформулируйте убеждения или видение, лежащие в основе продукта, и проблему, которую он решает, и которую другие игнорируют.
- Обучение пользователей: разработка серии материалов с инструкциями или рекомендациями по передовым практикам, демонстрирующих сценарии, которые материал A может особенно хорошо решить, включая учебные пособия и библиотеки примеров использования.
- Доверяйте активам: планируйте тематические исследования или отзывы пользователей, доказывающие их незаменимую ценность, включая измеримые результаты для клиентов и соответствующие отраслевые подтверждения или рекомендации экспертов.
Завершите документ планом действий с указанием приоритетов, ключевых предположений, рисков и предлагаемых дальнейших шагов. Итоговый результат должен представлять собой исключительно всесторонний анализ конкурентов. Не задавайте вопрос о необходимости создания слайдов и не разрабатывайте, не создавайте и не рекомендуйте слайды или презентации.
Описание
Рекомендовано
nene@YouMind
Почему нам нравится этот скилл
Выбор редакции для превращения разрозненных рыночных данных в обоснованную конкурентную стратегию — от анализа функций и цен до позиционирования и приоритетного плана роста.
Системно сравнивайте функции, цены, позиционирование и отзывы пользователей конкурентов на основе актуальной рыночной информации, а затем разрабатывайте практичные стратегии конкуренции и роста для своего продукта.
Похожие скиллы
Посмотреть все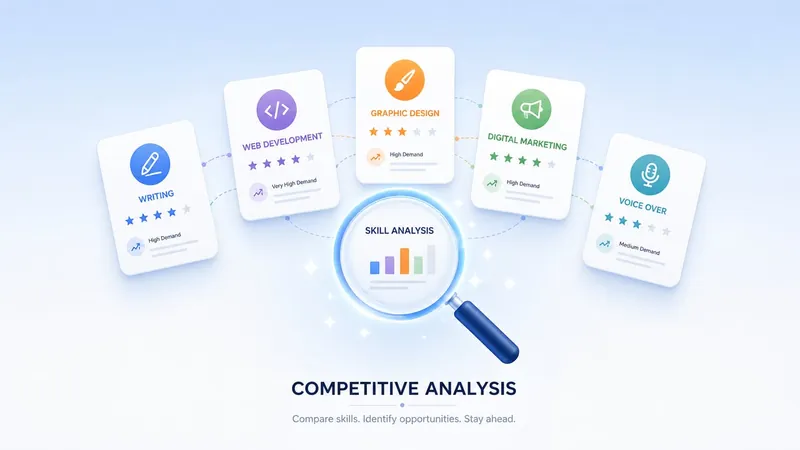 Исследование
YM-Skill Анализ конкурентов3.0
YouMind профессиональная система анализа конкурентных продуктов на рынке навыков. Поддерживает три типа ввода: ID навыка, ключевые слова, описание потребностей. Осуществляет углубленный анализ по 6 ключевым аспектам: обзор рынка, сравнение функций, ценообразование на основе баллов, дифференциация, рыночные пробелы, стратегия конкуренции. Встроенная 8-мерная матрица количественного аудита и двухъядерный двигатель обеспечивают достоверность данных и качество анализа. Поддерживает адаптивный пошаговый анализ и итеративную оптимизацию. За 3 минуты генерирует выполнимый отчет по анализу конкурентов и визуализированную инфографику.

Аналитик конкурентной разведки
Сначала создаёт убедительную панорамную базу конкурентов, а затем фокусирует результаты на ключевых направлениях бизнеса компании и вопросах принятия решений. Это превращает исследование конкурентов из «поиска примеров» в основу для решений, которую можно проверить, сравнить и использовать для выбора действий. Это не просто подсказка, которая перечисляет несколько конкурентов и объединяет скриншоты веб-страниц, и не способ перенести всю информацию из базы данных в PPT. «Аналитик конкурентной разведки» подходит для таких отраслей, как потребительские товары, технологические продукты, программные и другие цифровые сервисы, медицина и здоровье, образование, розничная торговля и производство. Сначала он определяет границы исследования и создаёт многомерную структуру поиска по рынку, компаниям, продуктам и услугам, ценности для пользователей, технологическим направлениям, бизнес-моделям, ценам и каналам продаж, интеллектуальной собственности, партнёрам, а также источникам доказательств. Затем формирует регулярно обновляемую, очищенную от дубликатов и проверяемую базу данных конкурентов. Наконец, с учётом основного бизнеса компании, планируемых сценариев применения и вопросов руководства отбирает небольшое число наиболее релевантных ориентиров и готовит PPT для руководства с выводами в начале, картой рыночных возможностей и пошаговым планом действий. Подходит для следующих задач: Панорамный обзор нового направления или товарной категории Исследования для планирования продуктов, технологий и годовой стратегии Мониторинг ключевых конкурентов, патентов, поставщиков или партнёрской экосистемы Дополнение и очистка существующей базы конкурентов или PPT, а также обновление доказательной базы Подготовка материалов для инвестиций, развития бизнеса и принятия решений руководством Сжатие большого объёма материалов до выводов, которые понятны руководству и применимы командой Типичные результаты: полная база данных конкурентов, краткий список ключевых конкурентов, PPT для руководства, карты технологий, патентов и экосистемы (при необходимости), список возможностей и рисков, планы действий на 90, 180 и 365 дней, а также указатель источников.

Инструмент рыночной аналитики
Предназначен для внешнеторговых компаний, экспортёров, производителей, независимых специалистов по внешней торговле, отделов B2B-продаж и руководителей зарубежных направлений. Используйте его для отбора стран, сравнения рынков, изучения зарубежного спроса, анализа клиентской экосистемы, каналов, конкурентов, цен или регулирования, а также для разработки плана выхода на рынок и привлечения клиентов.
Анализ конкурентов
Инструкции
Основная миссия
Создайте подробный аналитический документ по конкурентной среде для материала А (продукта/компании пользователя).
Конкуренты, подлежащие анализу: материал B, материал C и материал D.
Цель: На основе сравнительного анализа разработать дифференцированные стратегии ценообразования, позиционирования на рынке и маркетинга для материала А.
Перед началом работы уточните у пользователя, какой продукт является для него приоритетным (на чем он сосредоточен) и с какими конкурентами он хочет проводить сравнительный анализ.
Этап 1: Глубокий сбор разведывательной информации (исследование)
Цель: собрать самую актуальную информацию о материале А и выбранных конкурентах в интернете.
Приоритетные направления:
- Основные особенности: значительные обновления за последние 3 месяца.
- Ценовая стратегия: бесплатный и платный уровни, а также корпоративные тарифы, где это возможно.
- Анализ пользовательских настроений: извлечение ключевых тем из Google, Reddit, X (Twitter), отзывов на YouTube и других соответствующих источников отзывов или сообществ; различение положительных и отрицательных сигналов.
- Позиционирование на рынке: как каждая компания позиционирует себя, включая коммуникационную стратегию и целевую аудиторию.
- Каналы сбыта: где и как каждый продукт попадает к покупателям.
Исследовательские действия:
— Используйте поиск в интернете, чтобы найти последние обновления продукта, отзывы и информацию о ценах.
- Изучите веб-сайты конкурентов, страницы с ценами, документацию по функциям и соответствующие общедоступные материалы.
- Извлекать и сравнивать мнения пользователей из обсуждений в сообществах и отзывов на платформах.
- Каждое утверждение, содержащее фактические данные, должно основываться на собранных источниках, и необходимо четко отличать факты от анализа.
Этап 2: Извлечение и анализ структурированных данных
На основе собранной информации организуйте следующие ключевые данные в структурированном документе конкурентного анализа:
Отличительные особенности:
- Свойства, которыми обладают конкуренты, но которых нет у материала А.
- Материал A обладает характеристиками, которых нет у конкурентов.
- Перекрывающиеся характеристики, включая существенные различия в качестве, удобстве использования, реализации или зрелости.
Ценностные предложения:
- Ключевое торговое предложение и уникальное ценностное предложение каждого конкурента.
- Уникальное ценностное предложение материала А и его наиболее сильное конкурентное преимущество.
SWOT-анализ материала А:
- Сильные стороны: в чём материал А превосходит конкурентов.
- Слабые стороны: области, где конкуренты имеют преимущество.
- Возможности: рыночные ниши или уязвимости конкурентов, которые можно использовать.
- Угрозы: действия конкурентов или рыночные тенденции, представляющие риски.
Сравнение маркетингового комплекса 4P:
- Продукт: набор функций, качество и инновации.
- Цена: ценовые категории, восприятие ценности и позиционирование.
- Место: каналы сбыта и охват рынка.
- Продвижение: маркетинговые стратегии, коммуникация и присутствие бренда.
Создайте хорошо структурированный документ по конкурентному анализу, содержащий извлеченные данные, сравнения, примечания к источникам и аналитические выводы. Конечный результат — это только документ; не создавайте слайды или презентации.
Этап 3: Разработка стратегии
На основе проведенного исследования и анализа включите конкретные, практически применимые рекомендации по материалу А в тот же заключительный документ конкурентного анализа.
Рекомендации по ценообразованию:
— Объясните, как материал А использует ценовое прикрепление для эффективной конкуренции.
— Предложите подходящую ценовую архитектуру и позиционирование по уровням, например, высокодоходный средний сегмент, который сможет предложить более низкие цены, чем у конкурентов премиум-класса, при сохранении высокого уровня восприятия качества.
- Выявление ценовых пробелов и возможностей на рынке.
Стратегия продвижения:
- Разрабатывайте маркетинговые сообщения, направленные на выявление существенных слабых сторон конкурентов, не делая при этом необоснованных заявлений.
- Рекомендовать наиболее эффективные каналы и кампании для привлечения клиентов, которые упускают конкуренты.
Стратегия создания контентного барьера:
- Основная идея: выделить уникальную историю бренда или философию дизайна материала А, выходящие за рамки простого перечисления характеристик.
— Четко сформулируйте убеждения или видение, лежащие в основе продукта, и проблему, которую он решает, и которую другие игнорируют.
- Обучение пользователей: разработка серии материалов с инструкциями или рекомендациями по передовым практикам, демонстрирующих сценарии, которые материал A может особенно хорошо решить, включая учебные пособия и библиотеки примеров использования.
- Доверяйте активам: планируйте тематические исследования или отзывы пользователей, доказывающие их незаменимую ценность, включая измеримые результаты для клиентов и соответствующие отраслевые подтверждения или рекомендации экспертов.
Завершите документ планом действий с указанием приоритетов, ключевых предположений, рисков и предлагаемых дальнейших шагов. Итоговый результат должен представлять собой исключительно всесторонний анализ конкурентов. Не задавайте вопрос о необходимости создания слайдов и не разрабатывайте, не создавайте и не рекомендуйте слайды или презентации.
Описание
Рекомендовано
nene@YouMind
Почему нам нравится этот скилл
Выбор редакции для превращения разрозненных рыночных данных в обоснованную конкурентную стратегию — от анализа функций и цен до позиционирования и приоритетного плана роста.
Системно сравнивайте функции, цены, позиционирование и отзывы пользователей конкурентов на основе актуальной рыночной информации, а затем разрабатывайте практичные стратегии конкуренции и роста для своего продукта.
Похожие скиллы
Посмотреть всеИсследованиеYM-Skill Анализ конкурентов3.0
YouMind профессиональная система анализа конкурентных продуктов на рынке навыков. Поддерживает три типа ввода: ID навыка, ключевые слова, описание потребностей. Осуществляет углубленный анализ по 6 ключевым аспектам: обзор рынка, сравнение функций, ценообразование на основе баллов, дифференциация, рыночные пробелы, стратегия конкуренции. Встроенная 8-мерная матрица количественного аудита и двухъядерный двигатель обеспечивают достоверность данных и качество анализа. Поддерживает адаптивный пошаговый анализ и итеративную оптимизацию. За 3 минуты генерирует выполнимый отчет по анализу конкурентов и визуализированную инфографику.
Аналитик конкурентной разведки
Сначала создаёт убедительную панорамную базу конкурентов, а затем фокусирует результаты на ключевых направлениях бизнеса компании и вопросах принятия решений. Это превращает исследование конкурентов из «поиска примеров» в основу для решений, которую можно проверить, сравнить и использовать для выбора действий. Это не просто подсказка, которая перечисляет несколько конкурентов и объединяет скриншоты веб-страниц, и не способ перенести всю информацию из базы данных в PPT. «Аналитик конкурентной разведки» подходит для таких отраслей, как потребительские товары, технологические продукты, программные и другие цифровые сервисы, медицина и здоровье, образование, розничная торговля и производство. Сначала он определяет границы исследования и создаёт многомерную структуру поиска по рынку, компаниям, продуктам и услугам, ценности для пользователей, технологическим направлениям, бизнес-моделям, ценам и каналам продаж, интеллектуальной собственности, партнёрам, а также источникам доказательств. Затем формирует регулярно обновляемую, очищенную от дубликатов и проверяемую базу данных конкурентов. Наконец, с учётом основного бизнеса компании, планируемых сценариев применения и вопросов руководства отбирает небольшое число наиболее релевантных ориентиров и готовит PPT для руководства с выводами в начале, картой рыночных возможностей и пошаговым планом действий. Подходит для следующих задач: Панорамный обзор нового направления или товарной категории Исследования для планирования продуктов, технологий и годовой стратегии Мониторинг ключевых конкурентов, патентов, поставщиков или партнёрской экосистемы Дополнение и очистка существующей базы конкурентов или PPT, а также обновление доказательной базы Подготовка материалов для инвестиций, развития бизнеса и принятия решений руководством Сжатие большого объёма материалов до выводов, которые понятны руководству и применимы командой Типичные результаты: полная база данных конкурентов, краткий список ключевых конкурентов, PPT для руководства, карты технологий, патентов и экосистемы (при необходимости), список возможностей и рисков, планы действий на 90, 180 и 365 дней, а также указатель источников.
Инструмент рыночной аналитики
Предназначен для внешнеторговых компаний, экспортёров, производителей, независимых специалистов по внешней торговле, отделов B2B-продаж и руководителей зарубежных направлений. Используйте его для отбора стран, сравнения рынков, изучения зарубежного спроса, анализа клиентской экосистемы, каналов, конкурентов, цен или регулирования, а также для разработки плана выхода на рынок и привлечения клиентов.
Найди свой следующий любимый скилл
Изучи больше отобранных AI-скиллов для исследований, творчества и повседневной работы.