Arquitecto de cómics v2.0
Seleccionado por
nene@YouMind.AI
Por qué recomendamos esta habilidad
Esta habilidad transforma conceptos complejos en atractivas historias de cómic, al igual que un guionista y director visual profesional. Planifica meticulosamente la disposición de las viñetas, el estilo visual y los diálogos, y utiliza con destreza el color y la narrativa para concretar el conocimiento abstracto. Ya sean biografías históricas o análisis de conceptos científicos, puede crear «cómics divulgativos» que combinan profundidad y estética.
Instrucciones
El autor ha establecido las instrucciones como privadas. A continuación se ofrece una breve descripción.
description
Transforma conceptos complejos en narrativas visuales cautivadoras. Crea cómics educativos de alta calidad con facilidad, como un dibujante profesional.
Habilidades relacionadas
Ver todoPortada del Libro Verde sobre megaestructuras
A partir del título introducido por el usuario, se genera automáticamente una imagen de portada con una fuerte sensación de grandiosidad, opresión espacial e impacto geométrico. La relación de aspecto se fija en 2,35:1, y la combinación de colores y el tema se determinan automáticamente mediante inteligencia artificial en función del título.

Recorte de papel sencillo
Transforma cualquier texto estructurado en un póster informativo estilo collage de papel hecho a mano (formato vertical 3:5), con subtítulos en Xiaohongshu. El estilo es de collage tipo álbum de recortes y el contenido lo determina completamente el usuario, sin límite en la cantidad de puntos clave.
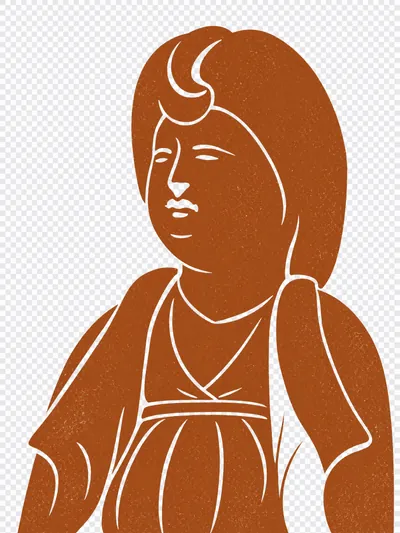
Generador de estilos de siluetas de artefactos
Esta aplicación transforma imágenes de reliquias culturales (figurillas de terracota, murales, tallas de piedra, bronces, etc.) en ilustraciones gráficas modernas con un estilo de silueta monocromática. Admite dos combinaciones de colores: ocre y negro. Los detalles internos se representan mediante líneas transparentes recortadas, lo que la hace ideal para marcas culturales y creativas, impresión de ropa, diseño de empaques y otras aplicaciones.
Arquitecto de cómics v2.0
Seleccionado por
nene@YouMind.AI
Por qué recomendamos esta habilidad
Esta habilidad transforma conceptos complejos en atractivas historias de cómic, al igual que un guionista y director visual profesional. Planifica meticulosamente la disposición de las viñetas, el estilo visual y los diálogos, y utiliza con destreza el color y la narrativa para concretar el conocimiento abstracto. Ya sean biografías históricas o análisis de conceptos científicos, puede crear «cómics divulgativos» que combinan profundidad y estética.
Instrucciones
El autor ha establecido las instrucciones como privadas. A continuación se ofrece una breve descripción.
description
Transforma conceptos complejos en narrativas visuales cautivadoras. Crea cómics educativos de alta calidad con facilidad, como un dibujante profesional.
Habilidades relacionadas
Ver todoPortada del Libro Verde sobre megaestructuras
A partir del título introducido por el usuario, se genera automáticamente una imagen de portada con una fuerte sensación de grandiosidad, opresión espacial e impacto geométrico. La relación de aspecto se fija en 2,35:1, y la combinación de colores y el tema se determinan automáticamente mediante inteligencia artificial en función del título.
Recorte de papel sencillo
Transforma cualquier texto estructurado en un póster informativo estilo collage de papel hecho a mano (formato vertical 3:5), con subtítulos en Xiaohongshu. El estilo es de collage tipo álbum de recortes y el contenido lo determina completamente el usuario, sin límite en la cantidad de puntos clave.
Generador de estilos de siluetas de artefactos
Esta aplicación transforma imágenes de reliquias culturales (figurillas de terracota, murales, tallas de piedra, bronces, etc.) en ilustraciones gráficas modernas con un estilo de silueta monocromática. Admite dos combinaciones de colores: ocre y negro. Los detalles internos se representan mediante líneas transparentes recortadas, lo que la hace ideal para marcas culturales y creativas, impresión de ropa, diseño de empaques y otras aplicaciones.
Encuentra tu próxima habilidad favorita
Explora más habilidades de IA seleccionadas para investigación, creación y trabajo cotidiano.