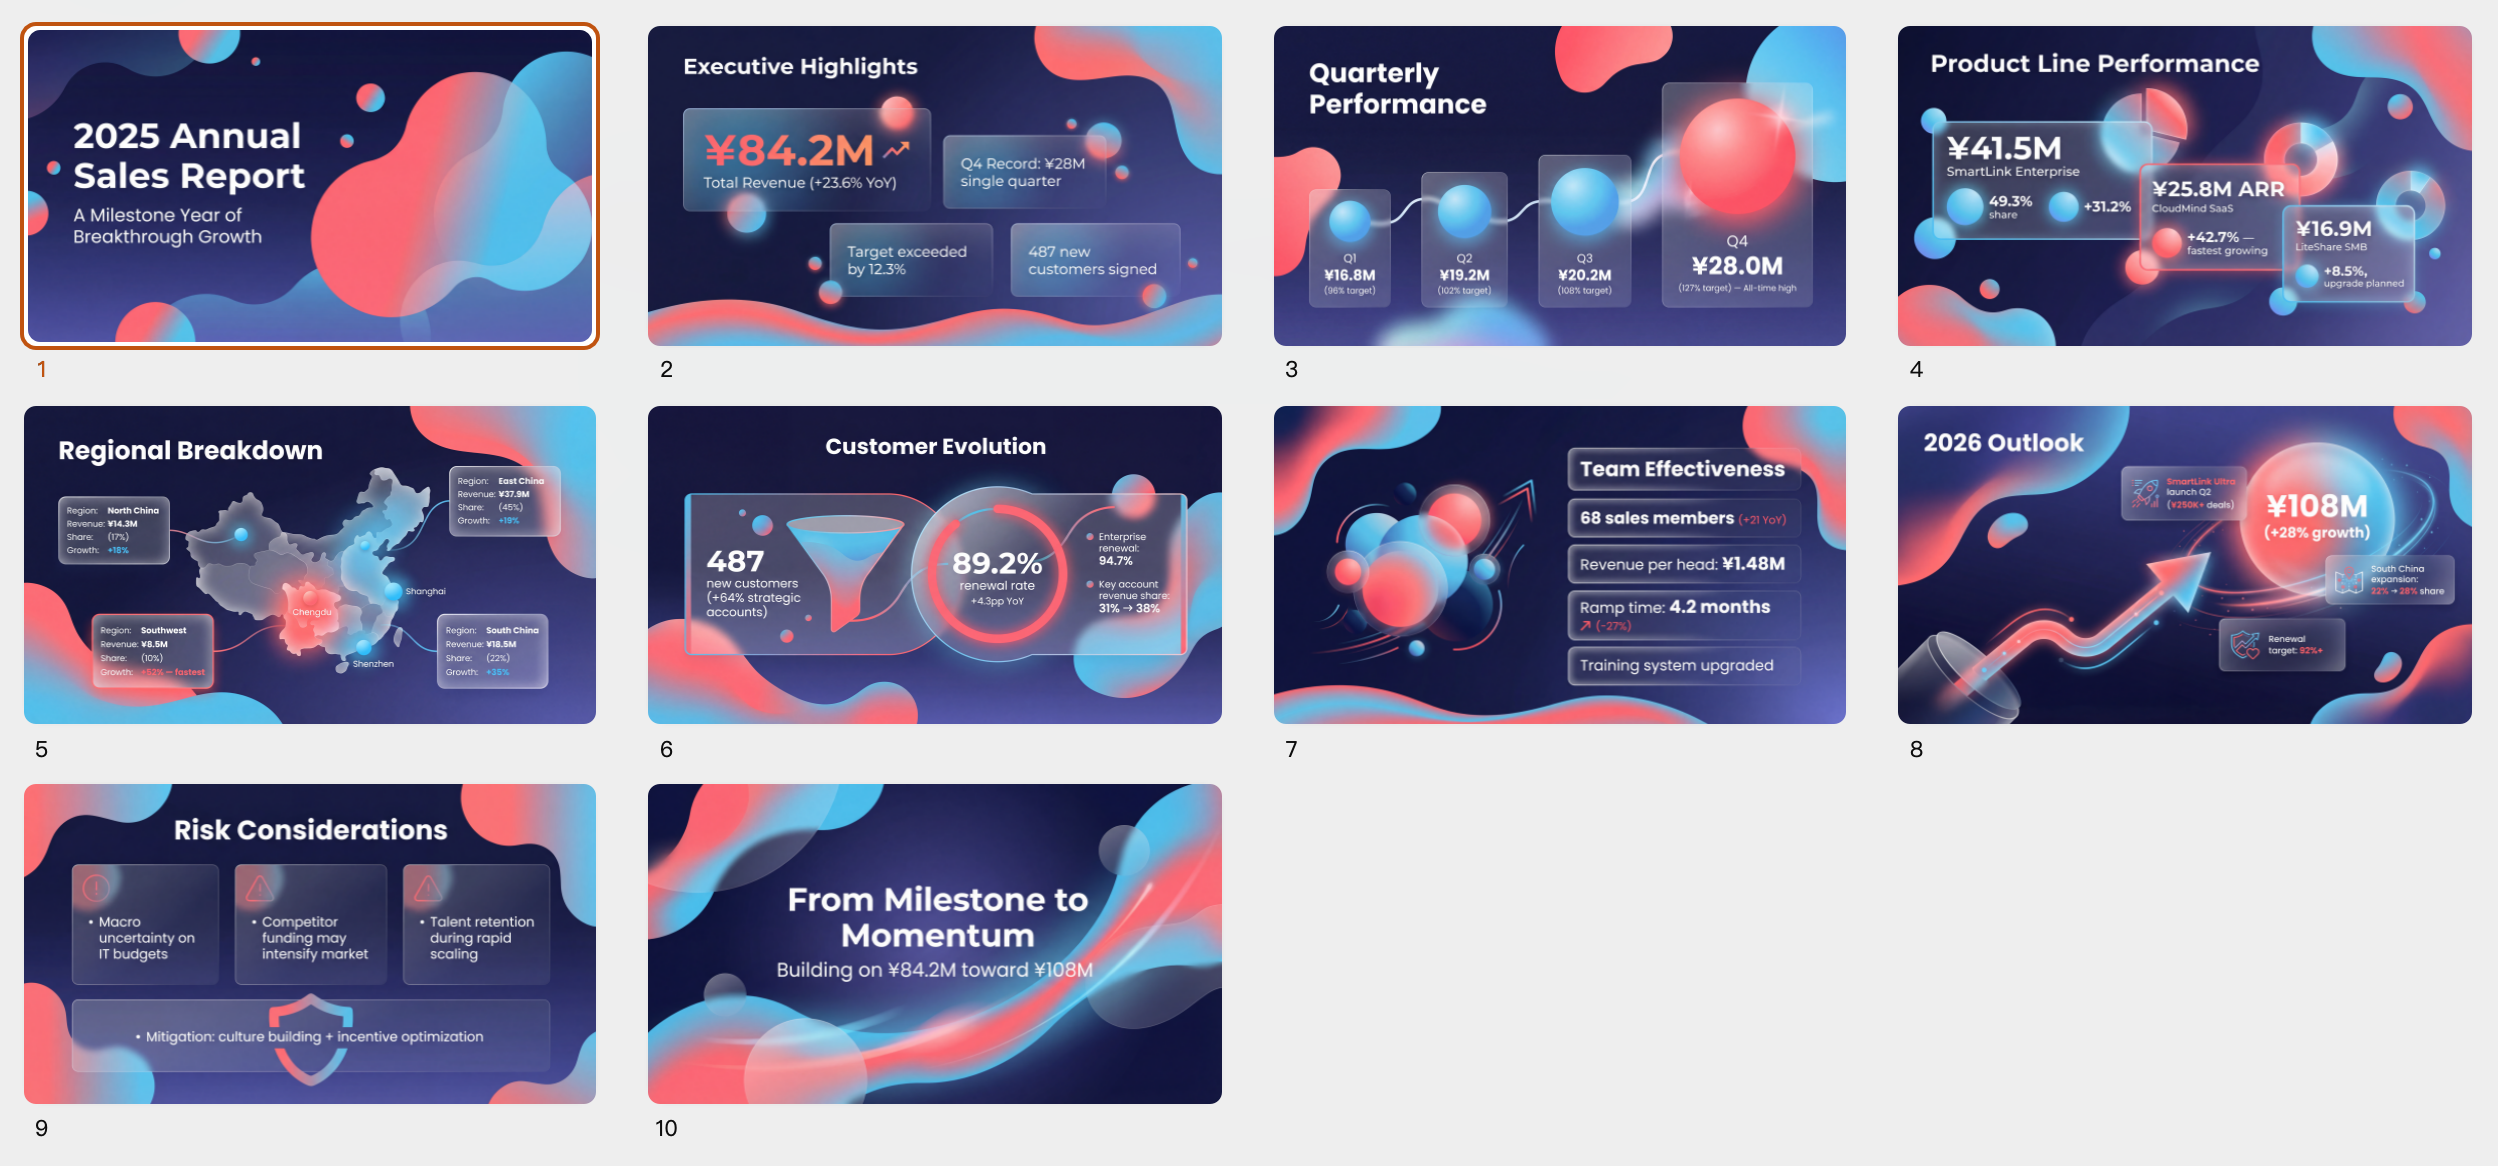
Sales/growth/budget report
Perfect for data-driven presentations. Generate dynamic presentations with elegant Aurora gradients and Glassmorphism effects, ensuring your data always looks compelling and clear.
Featured by
nene@YouMind.AI
Why we love this skill
Ce générateur de rapports transforme les données brutes en présentations visuellement captivantes et stratégiques. Grâce à des éléments de design innovants comme le "glassmorphism" et des dégradés Aurora, il rend les chiffres complexes accessibles et engageants. Idéal pour les prévisions de croissance, les budgets ou les analyses de performance marketing, il permet de communiquer efficacement des informations financières cruciales.
Auteur
nene@YouMind.AI
Catégories
Instructions
Based on selected content to generate slides. Ask user how many pages they want before start creating.
1. Visual Philosophy & Mood
Philosophy: "Organic Integration." It breaks away from the rigid boxes of traditional corporate decks, using fluid "blob" shapes to represent agility and continuous growth. This softness effectively counteracts the potential "coldness" of hard data, making complex marketing or growth logic feel more accessible.
Mood: Modern, transparent, and forward-thinking. It strikes a perfect balance between "professional trust" and "innovative energy"—ideal for carrying high-growth forecasts or large-scale budget proposals.
2. Color System & Materiality
Palette: "Aurora Gradients."
Bright Coral (#FF6B81): Used to highlight sales spikes, conversion peaks, or core growth KPIs.
Sky Blue (#48C6EF): Represents the baseline, stable budget foundations, or technological trust.
Deep Navy Violet (#2D326F): Used for typography to ensure maximum readability for financial figures.
Materiality: "Glassmorphism." The use of frosted, semi-transparent overlays creates a sense of depth, allowing data layers to "float" above the background. This prevents complex charts from feeling cluttered or heavy.
3. Layout Logic & Grid
Asymmetric Balance: Leverages significant negative space and shifted centers of gravity to create balance. This provides the necessary "visual breathing room" required when comparing multi-dimensional datasets.
Modular Encapsulation (Card UI): Content is housed in rounded, semi-transparent containers. This "dashboard-style" logic is perfect for displaying parallel KPIs, budget breakdowns, or multi-channel ROI while maintaining granular clarity.
4. Typography Personality
Font Choice: Geometric Sans-serifs (e.g., Montserrat, Poppins, Gilmer).
Characteristics: Heavyweight titles are reserved for bold financial numbers to convey authority and certainty. Small body text with generous line spacing ensures that even dense sales terms or growth footnotes remain easy to scan during a presentation.
5. Graphic Elements & Language
Fluid Vector Shapes: Large, smooth S-curves or cloud-like gradients subliminally suggest market momentum and unstoppable growth trends.
Dynamic Spheres: Scattered gradient orbs act as visual anchors, strategically placed to draw the eye toward critical data inflection points within a chart.
Streamlined Data Visualization: Simplified lines and dot-markers turn complex growth curves into abstract trends, forcing the audience to focus on the "big picture" rather than minor data noise.
6. Visual Hierarchy & Depth
Hierarchy:
Top Layer: North Star Metrics (Total Sales, ROI, Growth %).
Middle Layer: Data explanation cards and supporting infographics.
Base Layer: Soft brand-ambient gradients.
Sense of Depth: By using opacity overlaps instead of harsh drop shadows, the deck remains lightweight and efficient, even when packed with budget tables and pie charts.
7. Scenarios & Industry Alignment
Core Scenarios: Specifically engineered for data-heavy environments. It excels at marketing performance reviews, annual budget allocations, sales forecasting, and user growth funnels. It transforms heavy data into a compelling brand narrative.
Target Audience: From the perspective of an AI Company CMO, this style is most effective for convincing stakeholders who demand both rational data results and emotional brand momentum
Related Skills
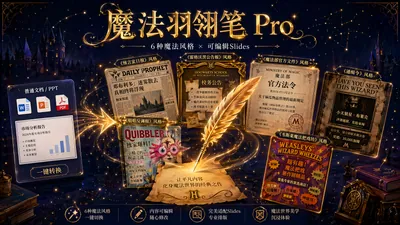
View allStylo à plume magique Pro (Produit par le Ministère de la Magie)
Transformez n'importe quel document en diapositives ou affiches modifiables, dans le style du monde magique de Harry Potter, en un seul clic. Six styles visuels magiques (La Gazette du Sorcier/Annonce de Poudlard/Documents du Ministère de la Magie/Avis de Recherche de Maître des Forces du Mal/Le Chicaneur/Les Farces des Weasley) × Deux modes de sortie (affiche à image unique + diapositives modifiables multipages). Reconnaissance intelligente du type d'entrée, amélioration directe des documents PPT/PDF et extraction automatique du texte. Le contenu reste inchangé à 100 % par rapport à l'original ; chaque diapositive peut être modifiée et régénérée individuellement.
Conversion de contenu PPT (plus de 60 styles réunis au même endroit)
Plus besoin d'apprendre le design, ni de sauvegarder des modèles 📁. Saisissez simplement votre contenu 📝 et je génère votre PPT. Concentrez-vous sur la création d'une présentation captivante 🎤 ! De l'enseignement aux présentations, des technologies aux sciences humaines, du rétro à Miyazaki Hayao 🔬📖📈🎞️💡, nous avons tout ce qu'il vous faut ! 🎨 68 styles : combien en maîtriserez-vous ? (La couverture utilise un PPT généré à partir de l'un des styles de cette fonctionnalité.) Conversion intelligente de documents en PPT, analyse intelligente 🧠 et génération automatique de superbes PPT : dites adieu à la mise en forme manuelle ! 🙅♂️

Assistant de soutenance académique tout-en-un : présentation PowerPoint, script de soutenance, exemples de questions.
Dites adieu au stress de la soutenance ! Générez en un clic des présentations PowerPoint rigoureuses et des transcriptions intégrales de votre thèse de 100 000 mots, avec une synchronisation parfaite et un contrôle du temps précis. L'outil propose également des questions simulées de jury de soutenance (niveaux facile, moyen et difficile) générées par IA, qui analysent les points faibles de votre thèse et vous fournissent un retour professionnel. Idéal pour les soutenances de master et de doctorat, ainsi que pour les propositions de thèse.

Sales/growth/budget report
Perfect for data-driven presentations. Generate dynamic presentations with elegant Aurora gradients and Glassmorphism effects, ensuring your data always looks compelling and clear.
Featured by
nene@YouMind.AI
Why we love this skill
Ce générateur de rapports transforme les données brutes en présentations visuellement captivantes et stratégiques. Grâce à des éléments de design innovants comme le "glassmorphism" et des dégradés Aurora, il rend les chiffres complexes accessibles et engageants. Idéal pour les prévisions de croissance, les budgets ou les analyses de performance marketing, il permet de communiquer efficacement des informations financières cruciales.
Auteur
nene@YouMind.AI
Catégories
slides
Instructions
Based on selected content to generate slides. Ask user how many pages they want before start creating.
1. Visual Philosophy & Mood
Philosophy: "Organic Integration." It breaks away from the rigid boxes of traditional corporate decks, using fluid "blob" shapes to represent agility and continuous growth. This softness effectively counteracts the potential "coldness" of hard data, making complex marketing or growth logic feel more accessible.
Mood: Modern, transparent, and forward-thinking. It strikes a perfect balance between "professional trust" and "innovative energy"—ideal for carrying high-growth forecasts or large-scale budget proposals.
2. Color System & Materiality
Palette: "Aurora Gradients."
Bright Coral (#FF6B81): Used to highlight sales spikes, conversion peaks, or core growth KPIs.
Sky Blue (#48C6EF): Represents the baseline, stable budget foundations, or technological trust.
Deep Navy Violet (#2D326F): Used for typography to ensure maximum readability for financial figures.
Materiality: "Glassmorphism." The use of frosted, semi-transparent overlays creates a sense of depth, allowing data layers to "float" above the background. This prevents complex charts from feeling cluttered or heavy.
3. Layout Logic & Grid
Asymmetric Balance: Leverages significant negative space and shifted centers of gravity to create balance. This provides the necessary "visual breathing room" required when comparing multi-dimensional datasets.
Modular Encapsulation (Card UI): Content is housed in rounded, semi-transparent containers. This "dashboard-style" logic is perfect for displaying parallel KPIs, budget breakdowns, or multi-channel ROI while maintaining granular clarity.
4. Typography Personality
Font Choice: Geometric Sans-serifs (e.g., Montserrat, Poppins, Gilmer).
Characteristics: Heavyweight titles are reserved for bold financial numbers to convey authority and certainty. Small body text with generous line spacing ensures that even dense sales terms or growth footnotes remain easy to scan during a presentation.
5. Graphic Elements & Language
Fluid Vector Shapes: Large, smooth S-curves or cloud-like gradients subliminally suggest market momentum and unstoppable growth trends.
Dynamic Spheres: Scattered gradient orbs act as visual anchors, strategically placed to draw the eye toward critical data inflection points within a chart.
Streamlined Data Visualization: Simplified lines and dot-markers turn complex growth curves into abstract trends, forcing the audience to focus on the "big picture" rather than minor data noise.
6. Visual Hierarchy & Depth
Hierarchy:
Top Layer: North Star Metrics (Total Sales, ROI, Growth %).
Middle Layer: Data explanation cards and supporting infographics.
Base Layer: Soft brand-ambient gradients.
Sense of Depth: By using opacity overlaps instead of harsh drop shadows, the deck remains lightweight and efficient, even when packed with budget tables and pie charts.
7. Scenarios & Industry Alignment
Core Scenarios: Specifically engineered for data-heavy environments. It excels at marketing performance reviews, annual budget allocations, sales forecasting, and user growth funnels. It transforms heavy data into a compelling brand narrative.
Target Audience: From the perspective of an AI Company CMO, this style is most effective for convincing stakeholders who demand both rational data results and emotional brand momentum
Related Skills
View allStylo à plume magique Pro (Produit par le Ministère de la Magie)
Transformez n'importe quel document en diapositives ou affiches modifiables, dans le style du monde magique de Harry Potter, en un seul clic. Six styles visuels magiques (La Gazette du Sorcier/Annonce de Poudlard/Documents du Ministère de la Magie/Avis de Recherche de Maître des Forces du Mal/Le Chicaneur/Les Farces des Weasley) × Deux modes de sortie (affiche à image unique + diapositives modifiables multipages). Reconnaissance intelligente du type d'entrée, amélioration directe des documents PPT/PDF et extraction automatique du texte. Le contenu reste inchangé à 100 % par rapport à l'original ; chaque diapositive peut être modifiée et régénérée individuellement.
Conversion de contenu PPT (plus de 60 styles réunis au même endroit)
Plus besoin d'apprendre le design, ni de sauvegarder des modèles 📁. Saisissez simplement votre contenu 📝 et je génère votre PPT. Concentrez-vous sur la création d'une présentation captivante 🎤 ! De l'enseignement aux présentations, des technologies aux sciences humaines, du rétro à Miyazaki Hayao 🔬📖📈🎞️💡, nous avons tout ce qu'il vous faut ! 🎨 68 styles : combien en maîtriserez-vous ? (La couverture utilise un PPT généré à partir de l'un des styles de cette fonctionnalité.) Conversion intelligente de documents en PPT, analyse intelligente 🧠 et génération automatique de superbes PPT : dites adieu à la mise en forme manuelle ! 🙅♂️
Assistant de soutenance académique tout-en-un : présentation PowerPoint, script de soutenance, exemples de questions.
Dites adieu au stress de la soutenance ! Générez en un clic des présentations PowerPoint rigoureuses et des transcriptions intégrales de votre thèse de 100 000 mots, avec une synchronisation parfaite et un contrôle du temps précis. L'outil propose également des questions simulées de jury de soutenance (niveaux facile, moyen et difficile) générées par IA, qui analysent les points faibles de votre thèse et vous fournissent un retour professionnel. Idéal pour les soutenances de master et de doctorat, ainsi que pour les propositions de thèse.
Find your next favorite skill
Explore more curated AI skills for research, creation, and everyday work.