Kurumsal Strateji Merceği
Yüksek bilgi yoğunluklu strateji diyagramı
Açıklama
Öneren
Nico@YouMind
Bu beceriyi neden öneriyoruz
Bu beceri, yüksek bilgi yoğunluğu ile kurumsal strateji verilerini etkileyici görsellere dönüştürür, veri toplama, içgörü çıkarma ve profesyonel görselleştirmeyi benzersiz bir şekilde birleştirir; iş analistlerinin vazgeçilmez yardımcısıdır.
Yöneticilere stratejik analiz yapma konusunda uzman biri olarak bu acıyı çok iyi biliyorum: Elinizde bir sürü düzensiz sektör verisi var, ancak 'yarınki sunum için görsel bir analiz hazırlamanız' gerekiyor. Sonuçta üç gün uğraşıyor, verileri yedi kez düzeltiyor, grafikleri on sekiz versiyon ayarlıyorsunuz ve ortaya çıkan sonuç: Ya Excel ekran görüntüsü gibi çirkin, bakmaya bile kıyamıyorsunuz ya da renkler göz alıcı ama ana nokta kayboluyor. Bu araç tam da bu sorunu çözmek için. Verileri konuşturun, içgörüleri bir bakışta görünür kılın. 【İşlev】 Dağınık finansal rapor verilerini, sektör raporlarını, operasyonel göstergeleri saniyeler içinde profesyonel görselleştirilmiş grafiklere + stratejik içgörülere dönüştürün. 【Sonuç】 Veri girin → Doğrudan PPT'lere yapıştırılabilecek uzun görseller/grafikler otomatik oluşturulsun, 5 temel içgörü ile birlikte. 【Kim kullanır】 Yatırım bankacılığı/danışmanlık: Müşterilere hızlı sektör taraması. Kurumsal strateji departmanı: Patron sunum isteyince 10 dakikada hazır. Medya/içerik üreticileri: İş analizi makaleleri için profesyonel görseller.
İlgili beceriler
Tümünü gör
Fikirden Görsele
Bir resim, bir cümle yeter. Hiç şu deneyimi yaşadınız mı? Aklınızda harika bir fikir var, onu ünlülerin paylaştığı türden bir infografik haline getirmek istiyorsunuz, ama sonuç: - AI görsel aracını açıyorsunuz, komutları yazıp siliyorsunuz, çıkan görselin ya düzeni berbat ya da stili tamamen uyumsuz. - Birkaç komut şablonu deniyorsunuz, her seferinde üç dört kez ayarlama yapıyorsunuz, yarım saat geçiyor hâlâ bitmemiş. - Finans tarzı, geleneksel Çin tarzı, bilim tarzı, teknoloji tarzı... her seferinde renk paletini ve düzeni yeniden araştırmanız gerekiyor. Artık gerek yok. 「Fikirden Görsele」 tüm bunları otomatikleştiriyor: 'Duygu yönetimiyle ilgili bir görsel yap' diyorsunuz, kendisi sıcak geleneksel Çin tarzı mı yoksa iyileştirici bilim tarzı mı kullanacağına karar veriyor, duygu yönetimiyle ilgili temel bilgileri araştırıp derliyor, 6-8 modül kartına bölüyor, en iyi komutu oluşturuyor, kalite kontrol yapıyor – başarısız olursa otomatik tekrar, başarılı olursa size atıyor. Dört öldürücü yetenek, tamamen dahili: 🧠 Stil Motoru – Dört seçenekten ibaret değil. Konunuz finansla ilgiliyse otomatik olarak koyu mavi-altın, Çin kültürüyle ilgiliyse pirinç kağıdı ve mürekkep, teknolojiyle ilgiliyse camgöbeği-mor neon. Dört kategorinin dışında mı? Otomatik olarak yeni bir stil sentezler. Kahve ansiklopedisi → sıcak yemek tonları, spor ve fitness → canlı turuncu-gri. Bilmediği stil yok. 🔍 İçerik Beyni – Bir kelime verirseniz tüm interneti tarayıp içeriği tamamlar, bir metin verirseniz özünü çıkarır, hiçbir şey vermez sadece konu verirseniz bile sizin için net bir şekilde düzenler. Üç giriş yöntemi de uyumlu, ne kadar basit o kadar rahat. 📐 Düzen Danışmanı – Artan basamaklar, yan yana karşılaştırma, neden-sonuç zinciri, ana dallanma... beş mantık otomatik eşleşir. Sadece metni görsele doldurmaz, gerçekten bir infografik 'tasarlar'. ✅ Kendi Kendini Denetleme ve Düzeltme – Görsel oluşturulduktan sonra otomatik olarak düzeni, metin yoğunluğunu, görsel-metin oranını ve stil uyumunu kontrol eder. Sorun varsa otomatik ayarlar ve yeniden oluşturur, en fazla iki kez. İyi komut yazmayı bilmenize gerek yok, sadece konuşmanız yeterli. Bu beceri kimler için? - Sosyal medya içerik üreticileri: Her gün görsel yapmaları gerekiyor ama tasarım öğrenmek istemiyorlar. - Bilgi satıcıları: Ders içeriklerini görselleştirmek istiyorlar ama tasarımcıları yok. - Kurumsal eğitimciler: Profesyonel infografiklere ihtiyaçları var ama dış kaynak bütçeleri yok. - Fikri görsele dönüştürmek isteyen herkes. Özetle: Sizin fikriniz, onun görseli. Aradaki tüm zorlukları o halleder.
Hisse Senedi Rapor Yorumlayıcı
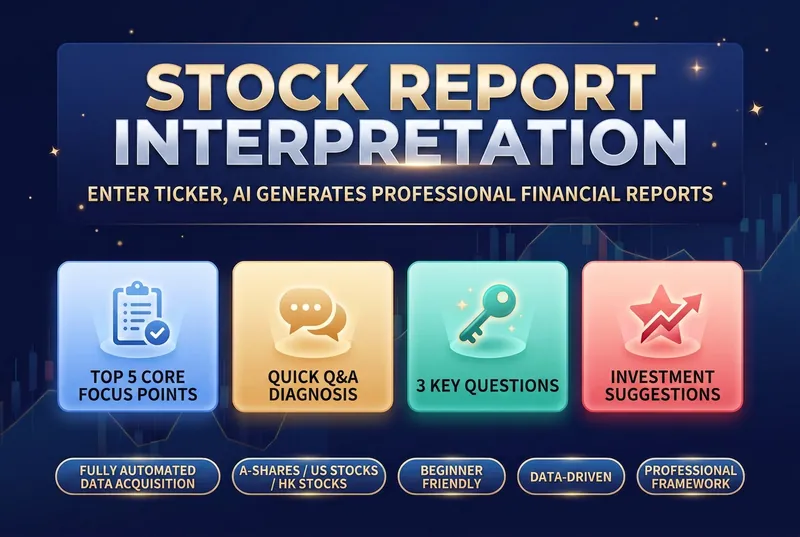
Mali raporlar, halka açık şirketlerin “sağlık raporu” gibidir; ancak çoğu yatırımcı, sayı yoğunluğu karşısında nereden başlayacağını bilemez: • 📝 Üç temel tabloyu anlayamamak — Bilanço, gelir tablosu ve nakit akış tablosu ne işe yarar? Hangi rakamlar en kritiktir? • 🤔 Neye bakacağını bilmemek — Onlarca sayfalık mali rapor karşısında hangi temel göstergelere odaklanacağını bilememek • 📊 Analiz çerçevesinin olmaması — Veriyi bulsa bile onu nasıl değerlendireceğini ve çapraz doğrulama yapacağını bilememek • 🏭 Sektör standartlarının farklı olması — Farklı sektörlerde “iyi” ölçütü tamamen değişir; imalat ve internet aynı kıstasla değerlendirilemez • ⏰ Zaman maliyetinin yüksek olması — Elle veri aramak, rakiplerle kıyaslamak, büyüme oranlarını hesaplamak; tek bir rapor için saatler harcamak Bu beceri, tam da bu sorunları çözmek için geliştirildi. Profesyonel finansal analistlerin analiz çerçevesini otomatikleştirir; tek yapmanız gereken bir hisse kodu girmek. Ardından yapılandırılmış, mantıklı ve yeni başlayanlar için anlaşılır bir mali rapor yorumu elde edersiniz. Bu aracın temel değeri; büyüme kalitesi değerlendirmesinden iş modeli analizine kadar birçok boyutu kapsayan sağlam analiz çerçevesinde yatar. Gelir, brüt kar marjı, net kar marjı ve nakit akışı gibi temel verileri karşılaştırmanın yanı sıra; yatırımcıların en çok önemsediği yedi kritik finansal soruya hızlı yanıtlar verir, kârın gerçekten nakde dönüşüp dönüşmediğini ve alacak hesapları ile stoklarda potansiyel risk bulunup bulunmadığını net biçimde ortaya koyar. Sektördeki referans şirketlerle yapılan karşılaştırmalı analiz sayesinde, şirketin değer zincirindeki gerçek konumunu belirlemenize yardımcı olur. Rapor oluşturulurken değerleme seviyesi, temel güçlü yönler ve potansiyel riskler bütünsel olarak değerlendirilir ve veriye dayalı izleme önerileri sunulur. Tüm analizler; anlaşılır tablolar ve sade bir dille aktarılır, karmaşık muhasebe kalemleri somut yatırım mantığına dönüştürülür. İster günlük gözden geçirme ister derinlemesine inceleme için olsun, bu araç size devasa veri yığınları içinde temel çelişkiyi hızla yakalama ve yatırım kararlarınızın verimliliği ile isabetliliğini artırma konusunda yardımcı olur.

E-ticaret Operasyon Panosu
📊 **Tek Cümlede Değer**: Mağaza verilerinizi yükleyin, AI otomatik olarak temel metrikler, trend grafikleri ve operasyon içgörüleriyle e-ticaret operasyon panosu oluşturur. 🔍 **Temel Özellikler**: - **Tek Tıkla Pano Oluşturma**: Herhangi bir e-ticaret yönetim panelinden dışa aktarılan verileri yükleyin, veriler otomatik olarak temizlenir, hesaplanır ve görselleştirilir. - **Beş Temel Metrik Sistemi**: Trafik, dönüşüm, satış, kullanıcı ve ürün — operasyonun tüm boyutlarını kapsar. - **Çoklu Pano Türleri**: Günlük rapor, canlı yayın panosu, ürün panosu ve kullanıcı panosu desteklenir; ihtiyaca göre geçiş yapılabilir. - **Akıllı İçgörü Motoru**: Trend kırılma noktalarını ve anormal dalgalanmaları otomatik olarak tespit eder, uygulanabilir operasyon önerileri üretir. - **Anında Kullanım**: Bağımsız bir HTML panosu çıktısı verir; çift tıklayarak tarayıcıda açılır, herhangi bir yapılandırma gerektirmez. 🎯 **Kullanım Senaryoları**: - 📊 Günlük/Haftalık Rapor Otomasyonu: Her gün 1 dakikada operasyon günlük raporu oluşturun, manuel tablo hazırlamayı bırakın. - 📈 Büyük İndirim Analizi: 618/11.11 sonrası tek tıkla kapsamlı bir değerlendirme paneli oluşturun. - 🛍️ Çoklu Platform Yönetimi: Taobao, JD.com, Douyin, Pinduoduo verileri için birleşik pano. - 🎯 Operasyon Kararları: Veriye dayalı ürün seçimi, fiyatlandırma ve reklam stratejisi ayarlamaları yapın. - 📱 Canlı Yayın Analizi: Canlı yayın oturumu verilerinden tek tıkla GPM, etkileşim oranı ve dönüşüm hunisi oluşturun. 👩💼 **Hedef Kitle**: E-ticaret operatörleri, mağaza yöneticileri, veri analistleri, canlı yayın operatörleri ve e-ticaret girişimcileri — mağaza performansını hızlıca izlemek isteyen herkes.
Kurumsal Strateji Merceği
Yüksek bilgi yoğunluklu strateji diyagramı
Açıklama
Öneren
Nico@YouMind
Bu beceriyi neden öneriyoruz
Bu beceri, yüksek bilgi yoğunluğu ile kurumsal strateji verilerini etkileyici görsellere dönüştürür, veri toplama, içgörü çıkarma ve profesyonel görselleştirmeyi benzersiz bir şekilde birleştirir; iş analistlerinin vazgeçilmez yardımcısıdır.
Yöneticilere stratejik analiz yapma konusunda uzman biri olarak bu acıyı çok iyi biliyorum: Elinizde bir sürü düzensiz sektör verisi var, ancak 'yarınki sunum için görsel bir analiz hazırlamanız' gerekiyor. Sonuçta üç gün uğraşıyor, verileri yedi kez düzeltiyor, grafikleri on sekiz versiyon ayarlıyorsunuz ve ortaya çıkan sonuç: Ya Excel ekran görüntüsü gibi çirkin, bakmaya bile kıyamıyorsunuz ya da renkler göz alıcı ama ana nokta kayboluyor. Bu araç tam da bu sorunu çözmek için. Verileri konuşturun, içgörüleri bir bakışta görünür kılın. 【İşlev】 Dağınık finansal rapor verilerini, sektör raporlarını, operasyonel göstergeleri saniyeler içinde profesyonel görselleştirilmiş grafiklere + stratejik içgörülere dönüştürün. 【Sonuç】 Veri girin → Doğrudan PPT'lere yapıştırılabilecek uzun görseller/grafikler otomatik oluşturulsun, 5 temel içgörü ile birlikte. 【Kim kullanır】 Yatırım bankacılığı/danışmanlık: Müşterilere hızlı sektör taraması. Kurumsal strateji departmanı: Patron sunum isteyince 10 dakikada hazır. Medya/içerik üreticileri: İş analizi makaleleri için profesyonel görseller.
İlgili beceriler
Tümünü görFikirden Görsele
Bir resim, bir cümle yeter. Hiç şu deneyimi yaşadınız mı? Aklınızda harika bir fikir var, onu ünlülerin paylaştığı türden bir infografik haline getirmek istiyorsunuz, ama sonuç: - AI görsel aracını açıyorsunuz, komutları yazıp siliyorsunuz, çıkan görselin ya düzeni berbat ya da stili tamamen uyumsuz. - Birkaç komut şablonu deniyorsunuz, her seferinde üç dört kez ayarlama yapıyorsunuz, yarım saat geçiyor hâlâ bitmemiş. - Finans tarzı, geleneksel Çin tarzı, bilim tarzı, teknoloji tarzı... her seferinde renk paletini ve düzeni yeniden araştırmanız gerekiyor. Artık gerek yok. 「Fikirden Görsele」 tüm bunları otomatikleştiriyor: 'Duygu yönetimiyle ilgili bir görsel yap' diyorsunuz, kendisi sıcak geleneksel Çin tarzı mı yoksa iyileştirici bilim tarzı mı kullanacağına karar veriyor, duygu yönetimiyle ilgili temel bilgileri araştırıp derliyor, 6-8 modül kartına bölüyor, en iyi komutu oluşturuyor, kalite kontrol yapıyor – başarısız olursa otomatik tekrar, başarılı olursa size atıyor. Dört öldürücü yetenek, tamamen dahili: 🧠 Stil Motoru – Dört seçenekten ibaret değil. Konunuz finansla ilgiliyse otomatik olarak koyu mavi-altın, Çin kültürüyle ilgiliyse pirinç kağıdı ve mürekkep, teknolojiyle ilgiliyse camgöbeği-mor neon. Dört kategorinin dışında mı? Otomatik olarak yeni bir stil sentezler. Kahve ansiklopedisi → sıcak yemek tonları, spor ve fitness → canlı turuncu-gri. Bilmediği stil yok. 🔍 İçerik Beyni – Bir kelime verirseniz tüm interneti tarayıp içeriği tamamlar, bir metin verirseniz özünü çıkarır, hiçbir şey vermez sadece konu verirseniz bile sizin için net bir şekilde düzenler. Üç giriş yöntemi de uyumlu, ne kadar basit o kadar rahat. 📐 Düzen Danışmanı – Artan basamaklar, yan yana karşılaştırma, neden-sonuç zinciri, ana dallanma... beş mantık otomatik eşleşir. Sadece metni görsele doldurmaz, gerçekten bir infografik 'tasarlar'. ✅ Kendi Kendini Denetleme ve Düzeltme – Görsel oluşturulduktan sonra otomatik olarak düzeni, metin yoğunluğunu, görsel-metin oranını ve stil uyumunu kontrol eder. Sorun varsa otomatik ayarlar ve yeniden oluşturur, en fazla iki kez. İyi komut yazmayı bilmenize gerek yok, sadece konuşmanız yeterli. Bu beceri kimler için? - Sosyal medya içerik üreticileri: Her gün görsel yapmaları gerekiyor ama tasarım öğrenmek istemiyorlar. - Bilgi satıcıları: Ders içeriklerini görselleştirmek istiyorlar ama tasarımcıları yok. - Kurumsal eğitimciler: Profesyonel infografiklere ihtiyaçları var ama dış kaynak bütçeleri yok. - Fikri görsele dönüştürmek isteyen herkes. Özetle: Sizin fikriniz, onun görseli. Aradaki tüm zorlukları o halleder.
Hisse Senedi Rapor Yorumlayıcı
Mali raporlar, halka açık şirketlerin “sağlık raporu” gibidir; ancak çoğu yatırımcı, sayı yoğunluğu karşısında nereden başlayacağını bilemez: • 📝 Üç temel tabloyu anlayamamak — Bilanço, gelir tablosu ve nakit akış tablosu ne işe yarar? Hangi rakamlar en kritiktir? • 🤔 Neye bakacağını bilmemek — Onlarca sayfalık mali rapor karşısında hangi temel göstergelere odaklanacağını bilememek • 📊 Analiz çerçevesinin olmaması — Veriyi bulsa bile onu nasıl değerlendireceğini ve çapraz doğrulama yapacağını bilememek • 🏭 Sektör standartlarının farklı olması — Farklı sektörlerde “iyi” ölçütü tamamen değişir; imalat ve internet aynı kıstasla değerlendirilemez • ⏰ Zaman maliyetinin yüksek olması — Elle veri aramak, rakiplerle kıyaslamak, büyüme oranlarını hesaplamak; tek bir rapor için saatler harcamak Bu beceri, tam da bu sorunları çözmek için geliştirildi. Profesyonel finansal analistlerin analiz çerçevesini otomatikleştirir; tek yapmanız gereken bir hisse kodu girmek. Ardından yapılandırılmış, mantıklı ve yeni başlayanlar için anlaşılır bir mali rapor yorumu elde edersiniz. Bu aracın temel değeri; büyüme kalitesi değerlendirmesinden iş modeli analizine kadar birçok boyutu kapsayan sağlam analiz çerçevesinde yatar. Gelir, brüt kar marjı, net kar marjı ve nakit akışı gibi temel verileri karşılaştırmanın yanı sıra; yatırımcıların en çok önemsediği yedi kritik finansal soruya hızlı yanıtlar verir, kârın gerçekten nakde dönüşüp dönüşmediğini ve alacak hesapları ile stoklarda potansiyel risk bulunup bulunmadığını net biçimde ortaya koyar. Sektördeki referans şirketlerle yapılan karşılaştırmalı analiz sayesinde, şirketin değer zincirindeki gerçek konumunu belirlemenize yardımcı olur. Rapor oluşturulurken değerleme seviyesi, temel güçlü yönler ve potansiyel riskler bütünsel olarak değerlendirilir ve veriye dayalı izleme önerileri sunulur. Tüm analizler; anlaşılır tablolar ve sade bir dille aktarılır, karmaşık muhasebe kalemleri somut yatırım mantığına dönüştürülür. İster günlük gözden geçirme ister derinlemesine inceleme için olsun, bu araç size devasa veri yığınları içinde temel çelişkiyi hızla yakalama ve yatırım kararlarınızın verimliliği ile isabetliliğini artırma konusunda yardımcı olur.
E-ticaret Operasyon Panosu
📊 **Tek Cümlede Değer**: Mağaza verilerinizi yükleyin, AI otomatik olarak temel metrikler, trend grafikleri ve operasyon içgörüleriyle e-ticaret operasyon panosu oluşturur. 🔍 **Temel Özellikler**: - **Tek Tıkla Pano Oluşturma**: Herhangi bir e-ticaret yönetim panelinden dışa aktarılan verileri yükleyin, veriler otomatik olarak temizlenir, hesaplanır ve görselleştirilir. - **Beş Temel Metrik Sistemi**: Trafik, dönüşüm, satış, kullanıcı ve ürün — operasyonun tüm boyutlarını kapsar. - **Çoklu Pano Türleri**: Günlük rapor, canlı yayın panosu, ürün panosu ve kullanıcı panosu desteklenir; ihtiyaca göre geçiş yapılabilir. - **Akıllı İçgörü Motoru**: Trend kırılma noktalarını ve anormal dalgalanmaları otomatik olarak tespit eder, uygulanabilir operasyon önerileri üretir. - **Anında Kullanım**: Bağımsız bir HTML panosu çıktısı verir; çift tıklayarak tarayıcıda açılır, herhangi bir yapılandırma gerektirmez. 🎯 **Kullanım Senaryoları**: - 📊 Günlük/Haftalık Rapor Otomasyonu: Her gün 1 dakikada operasyon günlük raporu oluşturun, manuel tablo hazırlamayı bırakın. - 📈 Büyük İndirim Analizi: 618/11.11 sonrası tek tıkla kapsamlı bir değerlendirme paneli oluşturun. - 🛍️ Çoklu Platform Yönetimi: Taobao, JD.com, Douyin, Pinduoduo verileri için birleşik pano. - 🎯 Operasyon Kararları: Veriye dayalı ürün seçimi, fiyatlandırma ve reklam stratejisi ayarlamaları yapın. - 📱 Canlı Yayın Analizi: Canlı yayın oturumu verilerinden tek tıkla GPM, etkileşim oranı ve dönüşüm hunisi oluşturun. 👩💼 **Hedef Kitle**: E-ticaret operatörleri, mağaza yöneticileri, veri analistleri, canlı yayın operatörleri ve e-ticaret girişimcileri — mağaza performansını hızlıca izlemek isteyen herkes.
Bir sonraki favori becerini bul
Araştırma, üretim ve günlük işler için özenle seçilmiş daha fazla AI becerisini keşfet.