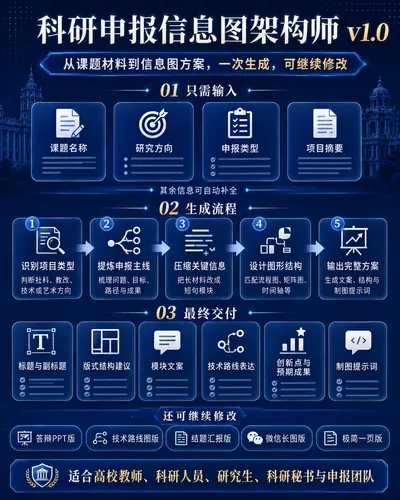
Инфографика для научных заявок
Создание текста инфографики из данных проекта
Описание
Превратите сложное содержание научной заявки в чёткую, профессиональную и убедительную инфографику. Она поможет вам: 1. Автоматически выделять ключевые моменты Из названия темы, предпосылок исследования, исследовательского вопроса, целей, содержания, технического маршрута и ожидаемых результатов извлекать наиболее подходящую для визуализации информацию. 2. Автоматически проектировать структуру инфографики Генерировать структуру инфографики «Проблема — Цель — Путь — Результат — Ценность» в зависимости от типа проекта, избегая нагромождения содержания и логической путаницы. 3. Автоматически генерировать текстовое наполнение Выводить заголовки, подзаголовки, названия модулей, короткие тексты, узлы процессов, метки результатов, пояснения к диаграммам и т.д., которые можно сразу передать дизайнеру или использовать для создания презентаций PowerPoint. 4. Автоматически подбирать визуальные способы представления Для каждого модуля предлагать подходящие графические формы, такие как блок-схемы, карты маршрутов, матричные диаграммы, временные шкалы, пирамиды, квадрантные диаграммы, деревья результатов, карты результатов и т.д. Подходит для: Преподавателей вузов, научных сотрудников, аспирантов, руководителей проектов, учёных секретарей, команд по подаче заявок, создателей научных презентаций PowerPoint. Как использовать: Просто введите название темы, тему исследования или вставьте фрагмент заявочных материалов. Вам не нужно предварительно форматировать текст — я автоматически распознаю ключевую информацию и сгенерирую план инфографики для научной заявки. Если материал неполный, я сначала создам рабочую версию и при необходимости задам 1–3 уточняющих вопроса.
Похожие скиллы
Посмотреть все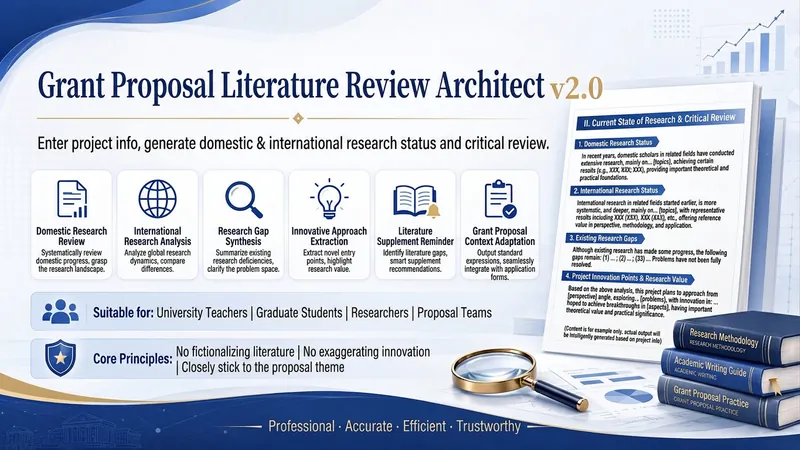
Архитектор обзора заявки 2.0
Введите информацию о теме — и получите обзор и аналитическую оценку отечественных и зарубежных исследований для заявки на исследовательский проект. Он поможет: 1. Автоматически разложить тему на ключевые элементы На основе названия темы, области и содержания исследования выделить основные понятия, объекты исследования, методологический путь и сферы применения. 2. Автоматически выстроить измерения обзора Разделить обзор состояния исследований на 3—4 отечественных и 2—3 зарубежных направления, чтобы избежать простого перечисления литературы и слабой логики изложения. 3. Автоматически подготовить аналитический текст Сформировать связный текст объёмом 900—1200 иероглифов в распространённой для заявок структуре: «состояние отечественных исследований — состояние зарубежных исследований — аналитическая оценка исследований». 4. Автоматически выявить пробелы в исследованиях Обобщить недостатки с точки зрения исследовательских подходов, междисциплинарного сочетания, построения моделей и практической проверки, а также естественно подвести к инновационной точке входа вашего проекта. Подходит для: преподавателей вузов, докторантов, магистрантов, научных сотрудников, руководителей исследовательских проектов, заявителей на проекты по реформированию образования, заявителей на исследовательские проекты в сфере образования, а также команд, подающих заявки в фонды социальных и гуманитарных наук. Способ использования: Просто введите название темы и направление исследования или вставьте фрагмент материалов заявки. Если у вас есть参考 литературы, вставьте её вместе с остальными данными — я в первую очередь использую предоставленные вами источники. Если参考 литературы нет, я создам «позиции для замены источниками» и «ключевые слова для поиска», чтобы не выдумывать конкретные публикации.
«AI Проектировщик научных маршрутов: Про»
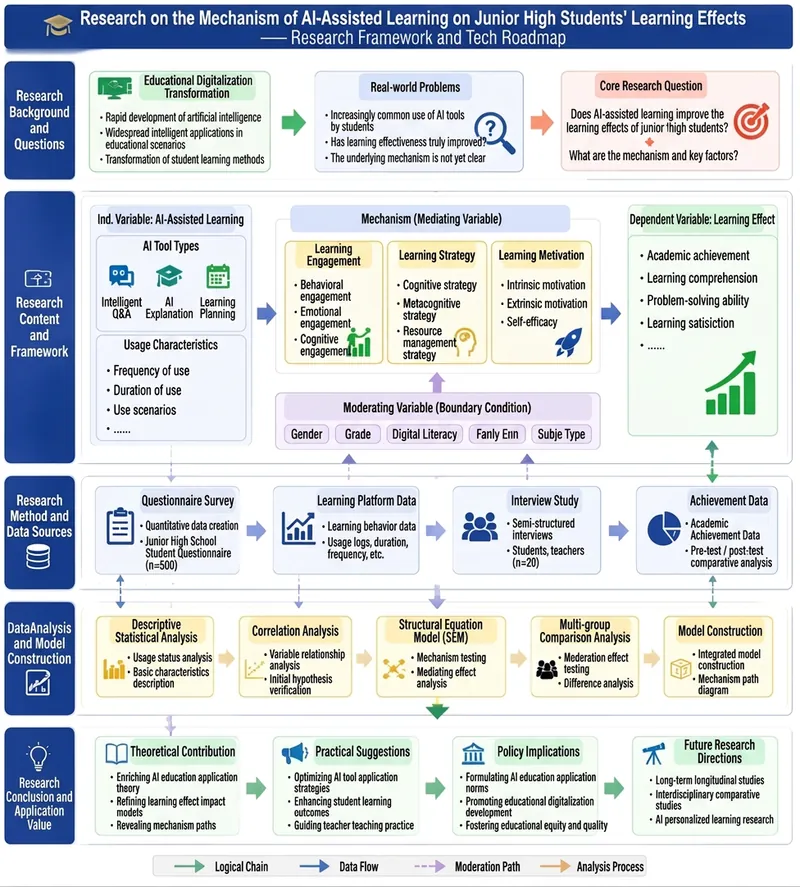
Сократите месяц на проработку литературы и схем, избегая многократных переделок. Введите тему исследования и получите научную дорожную карту, пригодную для отчётов и написания статей. Введите вашу исследовательскую тему — автоматически сгенерируется «Рамка исследования + Технический маршрут + Сюжетная линия статьи» уровня защиты диссертации. Подходит для магистров, аспирантов, молодых преподавателей, научных сотрудников и заявителей на гранты. Вам нужно лишь указать направление исследования, объект, цели, методы и текущие затруднения — система поможет структурировать: ① Формулировка исследования в одном предложении ② Дерево исследовательских вопросов ③ Рамка исследования ④ Технический маршрут ⑤ Сюжетная линия статьи ⑥ Временной план ⑦ Минимальный замкнутый цикл для выпуска ⑧ Промпты для AI-генерации изображений, готовые к использованию Особенно подходит для: Введения к диссертации, промежуточной аттестации, дипломной работы, заявки на грант, дизайна SCI статьи, подачи темы проекта. Мы не пишем за вас статьи, а помогаем превратить хаотичные идеи в технический маршрут, понятный научному руководителю и выполнимый вами.
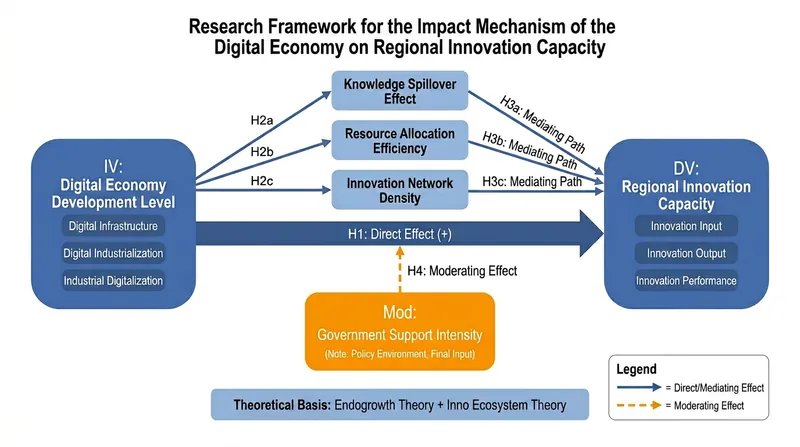
Научные схемы: рамка и маршрут
Создано для преподавателей вузов и всех, кто предъявляет высокие требования к качеству графиков. Этот навык позволяет одним кликом создавать схемы для заявок на проекты, учебные примеры, схемы для аргументации в статьях и т.д. Это инструмент визуализации, которым вы будете пользоваться с удовольствием. Введите тему и информацию об исследовании, и AI сгенерирует загружаемые изображения высокого разрешения, включая, но не ограничиваясь: • Исследовательская рамка: трёхколоночная компоновка (направление исследования | содержание | методы), академически выверенное оформление. • Технологическая карта: многоэтапная блок-схема с указанием методов, инструментов, инноваций и временных планов. • Диаграмма взаимосвязей переменных: путь IV→MV→DV, нумерация гипотез H1-H4, академическая цветовая гамма (синий и серый). Применение: журналистика, педагогика, менеджмент, технические науки и др. Результат: непосредственно генерируемые изображения, которые можно встраивать в заявки, презентации и т.д.
Инфографика для научных заявок
Создание текста инфографики из данных проекта
Описание
Превратите сложное содержание научной заявки в чёткую, профессиональную и убедительную инфографику. Она поможет вам: 1. Автоматически выделять ключевые моменты Из названия темы, предпосылок исследования, исследовательского вопроса, целей, содержания, технического маршрута и ожидаемых результатов извлекать наиболее подходящую для визуализации информацию. 2. Автоматически проектировать структуру инфографики Генерировать структуру инфографики «Проблема — Цель — Путь — Результат — Ценность» в зависимости от типа проекта, избегая нагромождения содержания и логической путаницы. 3. Автоматически генерировать текстовое наполнение Выводить заголовки, подзаголовки, названия модулей, короткие тексты, узлы процессов, метки результатов, пояснения к диаграммам и т.д., которые можно сразу передать дизайнеру или использовать для создания презентаций PowerPoint. 4. Автоматически подбирать визуальные способы представления Для каждого модуля предлагать подходящие графические формы, такие как блок-схемы, карты маршрутов, матричные диаграммы, временные шкалы, пирамиды, квадрантные диаграммы, деревья результатов, карты результатов и т.д. Подходит для: Преподавателей вузов, научных сотрудников, аспирантов, руководителей проектов, учёных секретарей, команд по подаче заявок, создателей научных презентаций PowerPoint. Как использовать: Просто введите название темы, тему исследования или вставьте фрагмент заявочных материалов. Вам не нужно предварительно форматировать текст — я автоматически распознаю ключевую информацию и сгенерирую план инфографики для научной заявки. Если материал неполный, я сначала создам рабочую версию и при необходимости задам 1–3 уточняющих вопроса.
Похожие скиллы
Посмотреть всеАрхитектор обзора заявки 2.0
Введите информацию о теме — и получите обзор и аналитическую оценку отечественных и зарубежных исследований для заявки на исследовательский проект. Он поможет: 1. Автоматически разложить тему на ключевые элементы На основе названия темы, области и содержания исследования выделить основные понятия, объекты исследования, методологический путь и сферы применения. 2. Автоматически выстроить измерения обзора Разделить обзор состояния исследований на 3—4 отечественных и 2—3 зарубежных направления, чтобы избежать простого перечисления литературы и слабой логики изложения. 3. Автоматически подготовить аналитический текст Сформировать связный текст объёмом 900—1200 иероглифов в распространённой для заявок структуре: «состояние отечественных исследований — состояние зарубежных исследований — аналитическая оценка исследований». 4. Автоматически выявить пробелы в исследованиях Обобщить недостатки с точки зрения исследовательских подходов, междисциплинарного сочетания, построения моделей и практической проверки, а также естественно подвести к инновационной точке входа вашего проекта. Подходит для: преподавателей вузов, докторантов, магистрантов, научных сотрудников, руководителей исследовательских проектов, заявителей на проекты по реформированию образования, заявителей на исследовательские проекты в сфере образования, а также команд, подающих заявки в фонды социальных и гуманитарных наук. Способ использования: Просто введите название темы и направление исследования или вставьте фрагмент материалов заявки. Если у вас есть参考 литературы, вставьте её вместе с остальными данными — я в первую очередь использую предоставленные вами источники. Если参考 литературы нет, я создам «позиции для замены источниками» и «ключевые слова для поиска», чтобы не выдумывать конкретные публикации.
«AI Проектировщик научных маршрутов: Про»
Сократите месяц на проработку литературы и схем, избегая многократных переделок. Введите тему исследования и получите научную дорожную карту, пригодную для отчётов и написания статей. Введите вашу исследовательскую тему — автоматически сгенерируется «Рамка исследования + Технический маршрут + Сюжетная линия статьи» уровня защиты диссертации. Подходит для магистров, аспирантов, молодых преподавателей, научных сотрудников и заявителей на гранты. Вам нужно лишь указать направление исследования, объект, цели, методы и текущие затруднения — система поможет структурировать: ① Формулировка исследования в одном предложении ② Дерево исследовательских вопросов ③ Рамка исследования ④ Технический маршрут ⑤ Сюжетная линия статьи ⑥ Временной план ⑦ Минимальный замкнутый цикл для выпуска ⑧ Промпты для AI-генерации изображений, готовые к использованию Особенно подходит для: Введения к диссертации, промежуточной аттестации, дипломной работы, заявки на грант, дизайна SCI статьи, подачи темы проекта. Мы не пишем за вас статьи, а помогаем превратить хаотичные идеи в технический маршрут, понятный научному руководителю и выполнимый вами.
Научные схемы: рамка и маршрут
Создано для преподавателей вузов и всех, кто предъявляет высокие требования к качеству графиков. Этот навык позволяет одним кликом создавать схемы для заявок на проекты, учебные примеры, схемы для аргументации в статьях и т.д. Это инструмент визуализации, которым вы будете пользоваться с удовольствием. Введите тему и информацию об исследовании, и AI сгенерирует загружаемые изображения высокого разрешения, включая, но не ограничиваясь: • Исследовательская рамка: трёхколоночная компоновка (направление исследования | содержание | методы), академически выверенное оформление. • Технологическая карта: многоэтапная блок-схема с указанием методов, инструментов, инноваций и временных планов. • Диаграмма взаимосвязей переменных: путь IV→MV→DV, нумерация гипотез H1-H4, академическая цветовая гамма (синий и серый). Применение: журналистика, педагогика, менеджмент, технические науки и др. Результат: непосредственно генерируемые изображения, которые можно встраивать в заявки, презентации и т.д.
Найди свой следующий любимый скилл
Изучи больше отобранных AI-скиллов для исследований, творчества и повседневной работы.