Sketchnote Artist
Featured by
nene@YouMind.AI
Why we love this skill
Trasforma informazioni complesse in riassunti visivi di facile comprensione con questo esclusivo Sketchnote Artist. Distilla i concetti chiave del tuo testo in diagrammi minimalisti disegnati a mano, perfetti per una comprensione rapida. Ideale per presentazioni, come strumento di studio o per spiegare processi complessi, dona chiarezza e coinvolgimento a qualsiasi argomento.
Istruzioni
L'autore ha impostato le istruzioni come private. Di seguito è riportata una breve descrizione.
description
Crea riassunti visivi come un esperto di Sketchnote. Questa scorciatoia trasforma qualsiasi testo in diagrammi chiari e disegnati a mano, garantendo che il tuo pubblico comprenda immediatamente anche le idee più complesse. Ottieni chiarezza senza sforzo.
Related Skills
View all
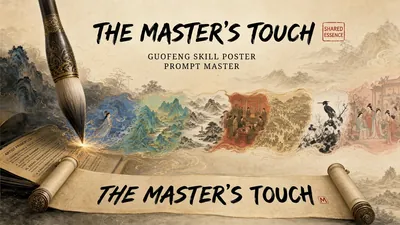
Tocco magistrale: Abile maestro nella creazione di poster in stile antico
Meta-abilità: Genera un prompt per poster unico in stile antico per qualsiasi pacchetto di abilità. Integra la grammatica visiva della pittura cinese antica (7 stili) con i framework di progettazione di poster (regola dei tre secondi/gerarchia delle informazioni/emozione del colore/formula di composizione/carattere e suono/ambizione dello spazio bianco), producendo un prompt bilingue (cinese e inglese). Supporta sia lo stile tradizionale della pittura antica che uno stile che condivide la stessa essenza artistica.
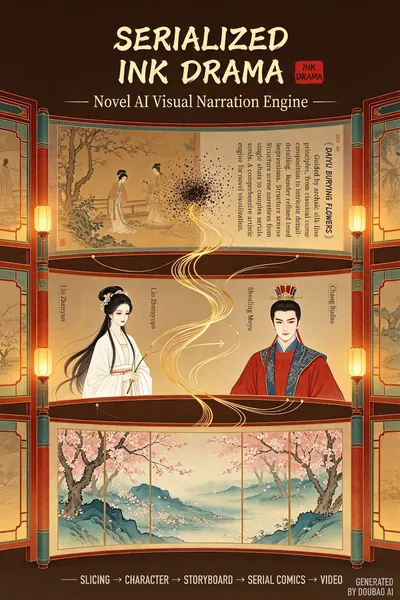
Ink Play Chapters: Motore narrativo visivo basato sull'intelligenza artificiale per romanzi
Si tratta di un motore completo per la trasformazione di testi di romanzi in fumetti storyboard professionali. Integra una libreria di stili a doppio binario con 14 stili cinesi antichi e 8 stili moderni, risolve i problemi di coerenza dei personaggi tra le immagini bloccando le immagini di design dei personaggi, supporta l'elaborazione di scene specifiche del romanzo come la suddivisione in capitoli, i fumetti di dialogo e gli storyboard d'azione, e genera prompt standardizzati che possono essere forniti direttamente agli strumenti di disegno basati sull'IA. La versione base si concentra sugli storyboard a fumetti, mentre la versione PRO migliora le funzionalità video. Inserisci un racconto breve e io genererò: ✓ Opzioni di suddivisione (racconto breve/capitolo singolo/capitolo lungo/libro completo - a tua scelta) ✓ Immagini di design dei personaggi (definisci prima l'aspetto dei personaggi, poi riutilizzali in ogni vignetta) ✓ Storyboard a 10 vignette (dimensioni della scena, emozioni, posizionamento del testo - tutto progettato) ✓ Libreria di stili a doppio binario: 14 stili antichi (Luoshen Fu Tu/Mille miglia di fiumi e montagne/Schizzi d'inchiostro di Shi Tao...) + 8 stili moderni (Makoto Shinkai/Cyberpunk/Fumetti americani/Fumetti coreani) ✓ Sintassi specifica per romanzi: Dialogo → fumetti, Psicologia → bordi frastagliati, Azione → linee di velocità ✓ Prompt di disegno AI fotogramma per fotogramma (bilingue cinese e inglese, copia e incolla direttamente) ✓ Versione PRO = video da 1,5 a 5 minuti + musica di sottofondo + script di editing + adattamento della piattaforma. Tre semplici passaggi: Dammi una breve storia e io ti fornirò una soluzione completa (scene + personaggi + storyboard + prompt). Tu la copi su Doubao/Keling/Jimeng, generi prima le immagini dei personaggi per conferma, poi generi le scene.
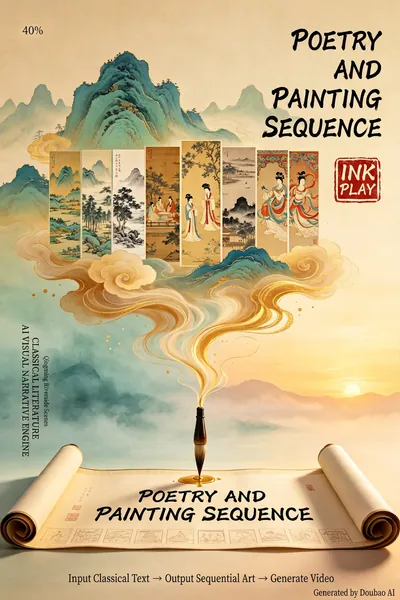
Poesia e pittura intrecciate: AI Visual Narrative Engine Pro per la letteratura classica.
Trasforma antiche poesie/testi cinesi in storyboard a fumetti generati dall'IA. Analisi approfondita del testo → progettazione dello storyboard → selezione dei personaggi → generazione di prompt fotogramma per fotogramma. Supporta 14 stili di pittura antica (come *La Dea del fiume Luo*, *Mille miglia di fiumi e montagne* e *Abitare sui monti Fuchun*), 7 schemi di layout e il riutilizzo obbligatorio di punti di ancoraggio visivi per garantire la coerenza dei personaggi. Una versione PRO opzionale genera una sceneggiatura video dinamica e uno schema di montaggio. Inserisci un testo antico e noi generiamo: ✓ Design dei personaggi (determiniamo prima l'aspetto dei personaggi, riutilizzato in ogni fotogramma) ✓ Storyboard a 8 fotogrammi (dimensioni dell'inquadratura, emozioni, posizione del testo: tutto progettato) ✓ Suggerimento di disegno AI fotogramma per fotogramma (bilingue in cinese e inglese, copia e incolla direttamente) ✓ 14 stili di pittura antica (*La Dea del Fiume Luo*, *Mille Miglia di Fiumi e Montagne*, *Abitare sui Monti Fuchun*, ecc., tutti verificabili) ✓ Schema di composizione (pagina aperta/rotolo lungo/striscia: raccontare una storia come sfogliare le pagine di un libro) ✓ Versione PRO = fumetto + storyboard video + musica di sottofondo + script di montaggio
Sketchnote Artist
Featured by
nene@YouMind.AI
Why we love this skill
Trasforma informazioni complesse in riassunti visivi di facile comprensione con questo esclusivo Sketchnote Artist. Distilla i concetti chiave del tuo testo in diagrammi minimalisti disegnati a mano, perfetti per una comprensione rapida. Ideale per presentazioni, come strumento di studio o per spiegare processi complessi, dona chiarezza e coinvolgimento a qualsiasi argomento.
Istruzioni
L'autore ha impostato le istruzioni come private. Di seguito è riportata una breve descrizione.
description
Crea riassunti visivi come un esperto di Sketchnote. Questa scorciatoia trasforma qualsiasi testo in diagrammi chiari e disegnati a mano, garantendo che il tuo pubblico comprenda immediatamente anche le idee più complesse. Ottieni chiarezza senza sforzo.
Related Skills
View allTocco magistrale: Abile maestro nella creazione di poster in stile antico
Meta-abilità: Genera un prompt per poster unico in stile antico per qualsiasi pacchetto di abilità. Integra la grammatica visiva della pittura cinese antica (7 stili) con i framework di progettazione di poster (regola dei tre secondi/gerarchia delle informazioni/emozione del colore/formula di composizione/carattere e suono/ambizione dello spazio bianco), producendo un prompt bilingue (cinese e inglese). Supporta sia lo stile tradizionale della pittura antica che uno stile che condivide la stessa essenza artistica.
Ink Play Chapters: Motore narrativo visivo basato sull'intelligenza artificiale per romanzi
Si tratta di un motore completo per la trasformazione di testi di romanzi in fumetti storyboard professionali. Integra una libreria di stili a doppio binario con 14 stili cinesi antichi e 8 stili moderni, risolve i problemi di coerenza dei personaggi tra le immagini bloccando le immagini di design dei personaggi, supporta l'elaborazione di scene specifiche del romanzo come la suddivisione in capitoli, i fumetti di dialogo e gli storyboard d'azione, e genera prompt standardizzati che possono essere forniti direttamente agli strumenti di disegno basati sull'IA. La versione base si concentra sugli storyboard a fumetti, mentre la versione PRO migliora le funzionalità video. Inserisci un racconto breve e io genererò: ✓ Opzioni di suddivisione (racconto breve/capitolo singolo/capitolo lungo/libro completo - a tua scelta) ✓ Immagini di design dei personaggi (definisci prima l'aspetto dei personaggi, poi riutilizzali in ogni vignetta) ✓ Storyboard a 10 vignette (dimensioni della scena, emozioni, posizionamento del testo - tutto progettato) ✓ Libreria di stili a doppio binario: 14 stili antichi (Luoshen Fu Tu/Mille miglia di fiumi e montagne/Schizzi d'inchiostro di Shi Tao...) + 8 stili moderni (Makoto Shinkai/Cyberpunk/Fumetti americani/Fumetti coreani) ✓ Sintassi specifica per romanzi: Dialogo → fumetti, Psicologia → bordi frastagliati, Azione → linee di velocità ✓ Prompt di disegno AI fotogramma per fotogramma (bilingue cinese e inglese, copia e incolla direttamente) ✓ Versione PRO = video da 1,5 a 5 minuti + musica di sottofondo + script di editing + adattamento della piattaforma. Tre semplici passaggi: Dammi una breve storia e io ti fornirò una soluzione completa (scene + personaggi + storyboard + prompt). Tu la copi su Doubao/Keling/Jimeng, generi prima le immagini dei personaggi per conferma, poi generi le scene.
Poesia e pittura intrecciate: AI Visual Narrative Engine Pro per la letteratura classica.
Trasforma antiche poesie/testi cinesi in storyboard a fumetti generati dall'IA. Analisi approfondita del testo → progettazione dello storyboard → selezione dei personaggi → generazione di prompt fotogramma per fotogramma. Supporta 14 stili di pittura antica (come *La Dea del fiume Luo*, *Mille miglia di fiumi e montagne* e *Abitare sui monti Fuchun*), 7 schemi di layout e il riutilizzo obbligatorio di punti di ancoraggio visivi per garantire la coerenza dei personaggi. Una versione PRO opzionale genera una sceneggiatura video dinamica e uno schema di montaggio. Inserisci un testo antico e noi generiamo: ✓ Design dei personaggi (determiniamo prima l'aspetto dei personaggi, riutilizzato in ogni fotogramma) ✓ Storyboard a 8 fotogrammi (dimensioni dell'inquadratura, emozioni, posizione del testo: tutto progettato) ✓ Suggerimento di disegno AI fotogramma per fotogramma (bilingue in cinese e inglese, copia e incolla direttamente) ✓ 14 stili di pittura antica (*La Dea del Fiume Luo*, *Mille Miglia di Fiumi e Montagne*, *Abitare sui Monti Fuchun*, ecc., tutti verificabili) ✓ Schema di composizione (pagina aperta/rotolo lungo/striscia: raccontare una storia come sfogliare le pagine di un libro) ✓ Versione PRO = fumetto + storyboard video + musica di sottofondo + script di montaggio
Find your next favorite skill
Explore more curated AI skills for research, creation, and everyday work.