七七

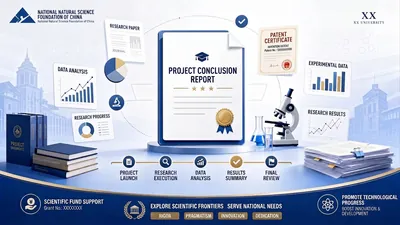
Vertical Project Completion Report Pro
[Essential for Project Completion Season] Create a high-quality project completion report in 3 hours and say goodbye to rejections! 🔥 Have you encountered these problems? → Project completion deadline approaching, unsure where to start with years of research data → Only after finishing writing do you realize you've missed assessment indicator benchmarking and funding execution rate explanations → Want to create professional charts to showcase your results, but don't know how to use complex tools → The generated report has an "AI-like" feel, worrying that reviewers will notice ✅ This skill solves all your problems at once: [Highlight 1] 8-step structured process × Checkpoint mechanism From information collection to final draft, every step has clear guidance and confirmation steps. Problems are intercepted at the generation stage, not discovered in the final draft. Covers all scenarios of National Natural Science Foundation of China/Provincial/Ministerial/University level. [Highlight 2] One-click generation of 6 major professional charts Built-in word cloud, bar chart, line chart and other sub-skill generators (no extra charge). AI intelligently recommends the most suitable chart type, generating charts in 30 seconds, allowing reviewers to understand your results at a glance. 【Highlight 3】Exclusive "AI-free" optimization of 4D AI trace detection + three optimization intensities (conservative/moderate/aggressive), replacing empty platitudes with more specific and in-depth expressions. The optimized report is not only more natural, but also has higher information density and stronger persuasiveness. 📩 Please send feedback/suggestions to: 1329806797@qq.com We don't just "write" your report, we help you "do" the entire project completion process correctly.
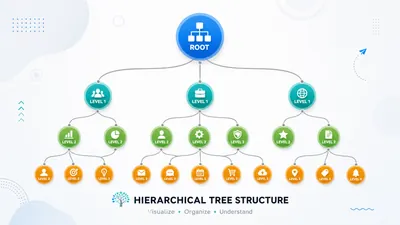
Tree diagram generator
【Generate Professional Tree Diagram with One Click】Input hierarchical structure data and generate an interactive tree diagram in 30 seconds. 🎯 Applicable Scenarios: → Research framework display → Knowledge classification hierarchy → Organizational chart → Work Breakdown Structure (WBS) → Literature classification system ✨ Key Features: • Based on professional-grade ECharts rendering, supports expand/collapse interaction • Supports top-down, left-right, and radial layouts • Automatically calculates node spacing to avoid overlap • Supports multi-level nesting, clearly displaying hierarchical relationships • Outputs an interactive HTML file that can be directly embedded in reports or presentations 📩 Feedback/Suggestions: 1329806797@qq.com A single diagram unfolds the hierarchical relationships, making complex structures clearly visible.
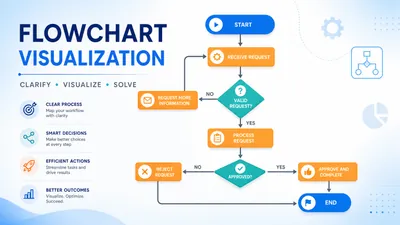
Flowchart generator
【Generate Professional Flowcharts with One Click】Describe process logic and generate clear and beautiful flowcharts/technology roadmaps in 30 seconds. 🎯 Applicable Scenarios: → Research Technology Roadmap → Experimental Operation Process → Project Execution Steps → Algorithm Logic Process → Decision Branch Graph ✨ Core Features: • Based on Mermaid academic-grade rendering, supports complex branching logic • Supports multiple layouts from top to bottom/left to right • Automatic node alignment and intelligent connection • Supports conditional judgment, parallel branching, and loop structures • Outputs clear vector graphics that can be directly embedded in papers or reports 📩 Feedback/Suggestions: 1329806797@qq.com Clarify complex processes with a single diagram, making the technology roadmap clear at a glance.
Pie chart generator
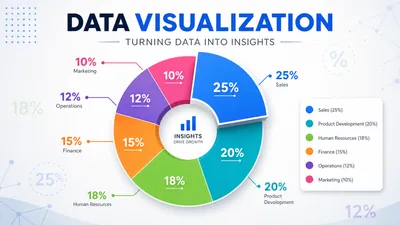
【Generate Professional Pie Charts with One Click】Enter your percentage data and generate a high-quality interactive pie chart/donkey chart in 30 seconds. 🎯 Applicable Scenarios: → Distribution of Research Outcome Types → Percentage of Funding Expenditure Structure → Percentage of Team Member Contributions → Sample Classification Analysis ✨ Key Features: • Based on ECharts professional-grade rendering, supporting interactive highlighting and data filtering • Supports multiple styles including pie charts, donkey charts, and rose charts • Automatically calculates percentages and intelligently labels • Outputs interactive HTML files that can be directly embedded in reports or presentations 📩 Feedback/Suggestions: 1329806797@qq.com A single chart clearly explains the percentage composition, making data distribution intuitively presented.
Line chart generator
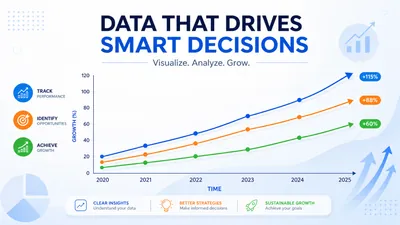
【Generate Professional Line Charts with One Click】Enter your time series data and generate a high-quality, interactive line chart in 30 seconds. 🎯 Applicable Scenarios: → Annual trend of paper publications → Experimental data change curves → Project progress timelines → Display of indicator growth/decline trends ✨ Key Features: • Based on ECharts professional-grade rendering, supporting zooming and data point hovering • Supports multiple line comparisons, area charts, and smooth curves • Automatically marks key inflection points and extreme values • Outputs interactive HTML files that can be directly embedded in reports or presentations 📩 Feedback/Suggestions: 1329806797@qq.com See trends clearly at a glance; let time series data tell its story.
Bar chart generator
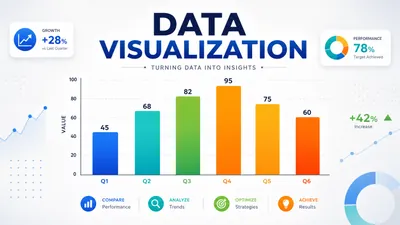
【Generate Professional Bar Charts with One Click】Enter your comparative data and generate a high-quality, interactive bar chart in 30 seconds. 🎯 Applicable Scenarios: → Comparison of multiple sets of experimental data → Comparison of budget vs. actual expenditure → Performance comparison of different methods → Statistics on the number of annual achievements ✨ Key Features: • Based on ECharts professional-grade rendering, supporting interactive zooming and data filtering • Supports regular bar charts, stacked bar charts, and grouped bar charts • Intelligent color matching + automatic numerical labeling, clear and intuitive • Outputs interactive HTML files that can be directly embedded in reports or presentations 📩 Feedback/Suggestions: 1329806797@qq.com Data comparisons are clear at a glance; let the charts convince your reviewers.
Word cloud generator
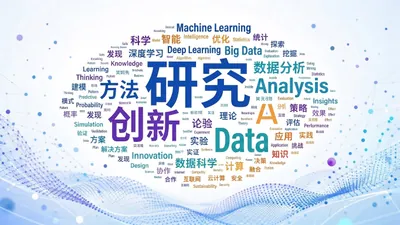
【Generate Professional Word Cloud with One Click】Enter keywords and weight data to generate a high-quality, interactive word cloud in 30 seconds. 🎯 Applicable Scenarios: → Keyword visualization for literature reviews → Research hotspot analysis and display → Keyword distribution in research reports → Data presentation for academic presentations ✨ Key Features: • Based on professional-grade ECharts rendering, supports interactive zooming • Intelligent color scheme, automatically adapts to academic styles • Supports custom word frequency weights to highlight core keywords • Outputs interactive HTML files that can be directly embedded in reports or presentations 📩 Feedback/Suggestions: 1329806797@qq.com Say goodbye to manual formatting, let the data speak for itself.

Scriptwriter Pro: Short drama storyboarding + AI prompts fully automated
Six-Dimensional Storytelling × Four-Dimensional Presentation Methodology: A Last-Mile Delivery Solution for Short Drama Scriptwriting. Starting with a single sentence of inspiration, through the six-dimensional formula + four-dimensional audiovisual elements, a complete script is delivered in nine steps—ultimately producing a storyboard and video prompts that can be directly copied and pasted into Keling/Runway/Pika. Five checkpoints ensure complete control over the direction. Applicable to short content formats such as vertical short dramas, comic strips, and single episodes of series.

Top-Journal Writing Mentor
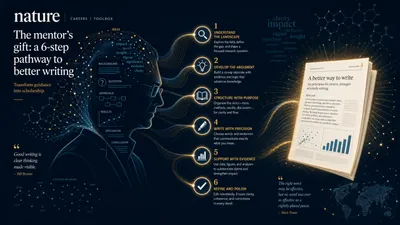
Your AI writing mentor that delivers publication-ready manuscripts while training you to think like a top-journal author. Every session produces a concrete output — a polished SCI paper written in the assertive rhetoric of Nature & Science — and simultaneously sharpens your scientific reasoning through deliberate practice. Across 6 guided steps, you learn to frame problems, lock domain terminology, calibrate epistemic tone, and construct publication-grade prose. You walk away with a finished manuscript today and stronger writing instincts tomorrow.

A Guide to Self-Help for Good Students
Have you ever felt exhausted by fear of making mistakes, excessive concern for others' opinions, habitual self-criticism, or an inability to stop? The "Good Student Mentality Self-Help Guide" can help you break free from these constraints and live a more carefree life. Based on the AFP three-dimensional personality model, this guide uses a cleverly designed nine-question test to accurately identify your "good student mentality" type, ranging from "tense tension" to "free creator," revealing your deep-seated patterns. Based on your test results, the system will tailor a personalized plan for awareness, tracing the origins, loosening, and rebuilding. You will ask specific questions through visual imagery to trace the origins of your mindset; receive exclusive "untying mantras" to interrupt old patterns when they resurface; and try a series of "counterintuitive actions" and daily exercises to gradually adjust your behavioral patterns, rather than simply demanding "you be confident." Whether you are a silently draining "lone warrior," a "running rabbit" forever chasing the next goal, or a perfectionist "refined dancer," this guide will provide you with practical micro-actions and profound guidance. It doesn't make you "better," but rather helps you discover that you're already good enough, helps you unload unnecessary burdens, enjoy the process, accept yourself, and ultimately find your own relaxation and creativity.

Top Journal Imitation Techniques: Seven Steps to Customized Writing for SCI Journals
Learn how to write SCI papers for top journals. Let AI learn from the examples you provide in top journals before writing your SCI paper. Seven steps from experimental data to English manuscript: Literature review → Data to title → Discovery extraction → Example learning → Chinese writing → Chinese-to-English translation and polishing → Comparative learning. The method has been verified sentence by sentence by real literature from CEJ 2021—the AI-generated paper scored 81 points, while the real paper scored 90 points, a difference of only 9 points. Suitable for SCI papers submitted by graduate students in science and engineering and young teachers. Also applicable to social sciences. Customer service WeChat: foreverme17, feedback is welcome. The first three are free, and each subsequent three entries increase by 500, up to a maximum of 20,000. (If you find that you haven't increased your score after three entries, congratulations, I'm asleep, hurry up and grab this opportunity!)

A master of creating WeChat articles in various styles (complaints, sharp criticisms, etc.).
This is a complete article creation skill set designed specifically for WeChat Official Account authors. It features a four-stage closed loop: Topic Discovery → Article Writing → Visual Layout → Publication Preparation. Stage 2 employs a three-layer architecture: universal ironclad rules ("Strict Editing Manual") + style-specific guidelines (such as "News Commentary Style Manual") + execution process, producing high-quality articles that are insightful, witty, informative, and free of AI influence. It supports four styles: in-depth thinking, news commentary, practical sharing, and sharp commentary. The publication stage produces a WeChat Official Account-compatible, pasteable version + image list + 5-step operation guide, completing publication preparation within 5 minutes.