Viral Archive Infographics
One title, one archival character infographic
Viral Archive Infographics
One title, one archival character infographic
Showcase
Description
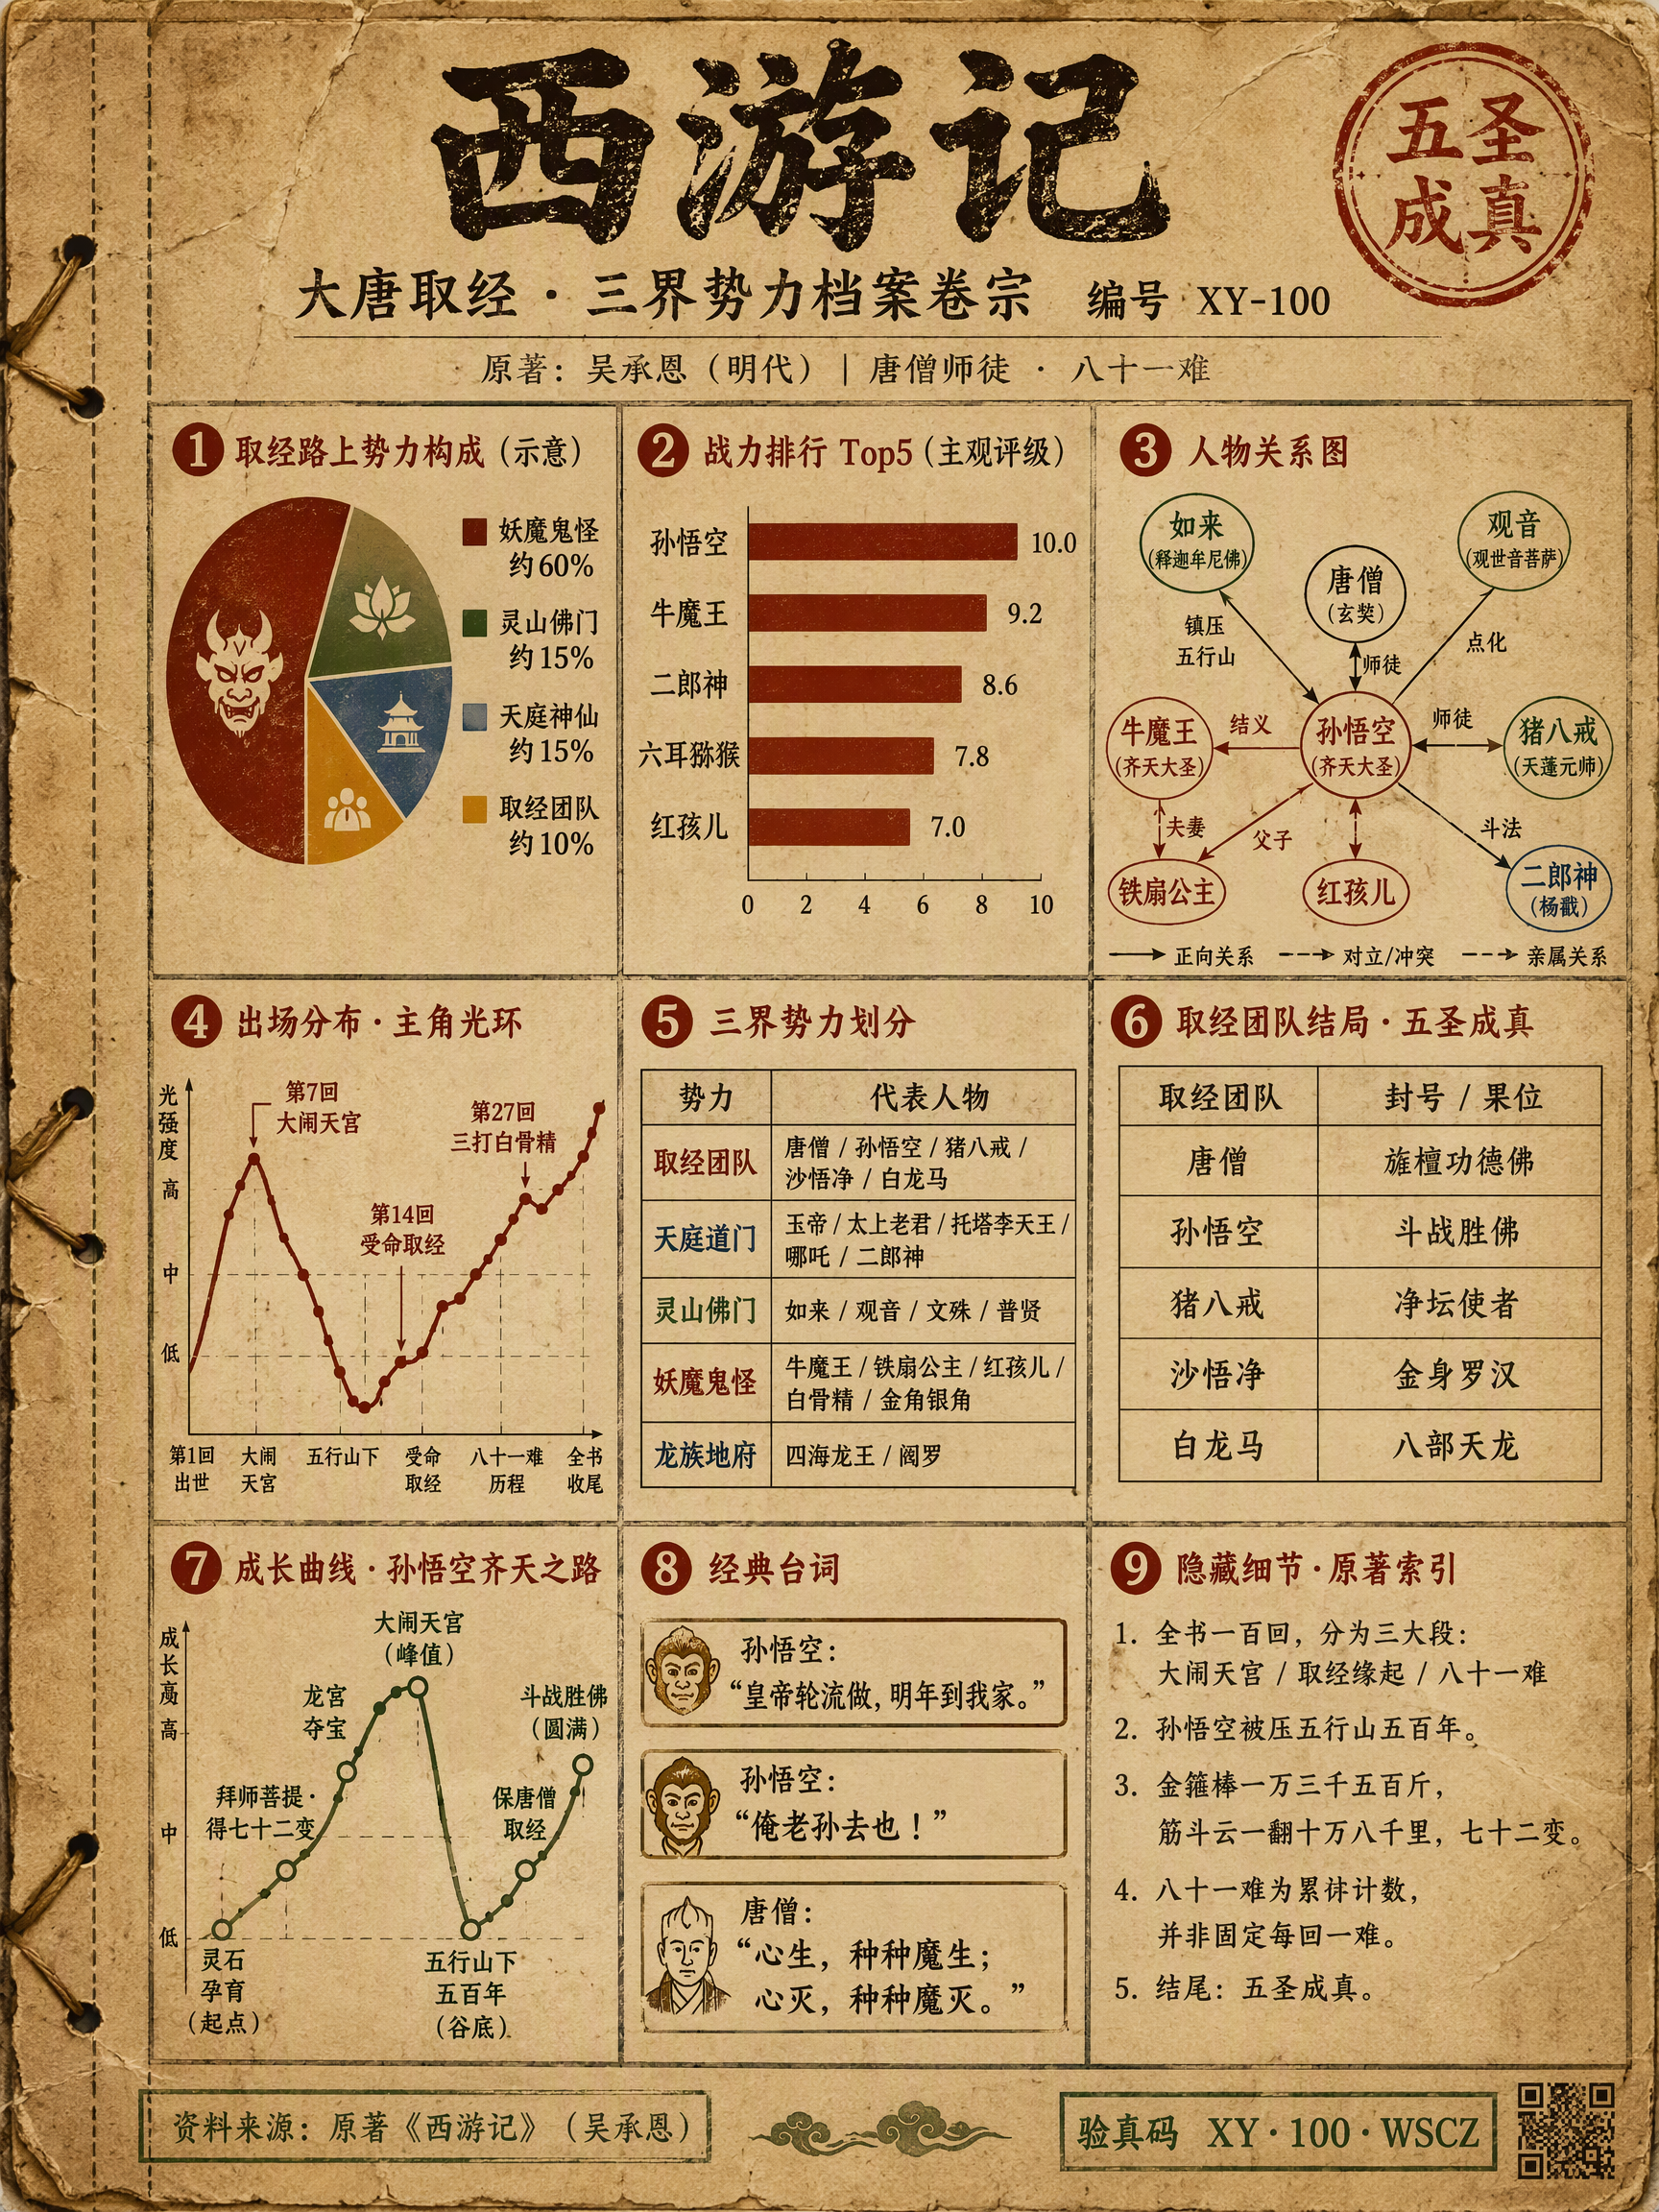
Enter the name of any classic literary or film/TV work. The Skill automatically searches online for the original text and official canon, then creates a 3:4 vertical character-relationship infographic styled like a vintage kraft-paper archive file. It covers nine dimensions: faction proportions, power/intelligence rankings, relationship networks, appearance distribution, faction and ending tables, corruption arcs, classic lines, and hidden details. It also includes source references and an anti-counterfeit code. You receive only the finished image—no code.
Recommended by
淡苍
Why we love this skill
Turn one title into a saveable 3:4 vintage archive-style character infographic with traceable sources, labeled subjective elements, and strong information density.
Related Skills
View all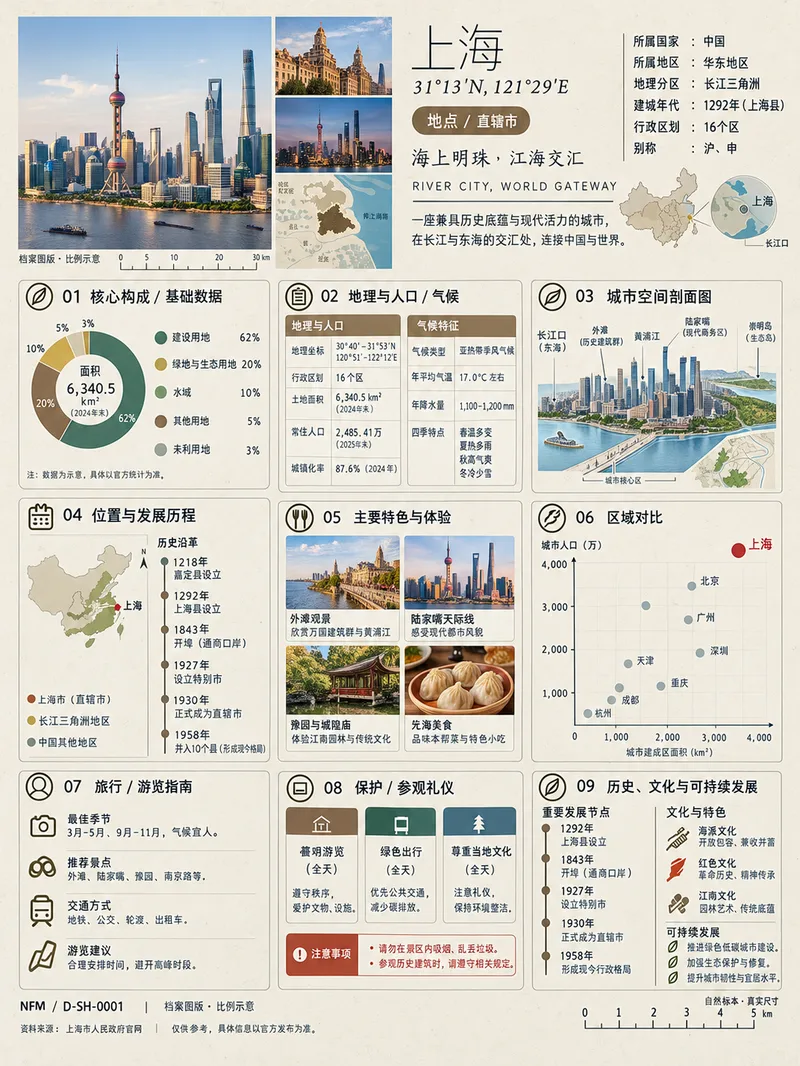 Image
Image(Trending) Anything as an Infographic
A trending infographic generator. Enter the name of any subject, and it automatically identifies the type—such as a living thing, mineral or material, man-made object, place or building, cultural concept, or historical figure—then creates a dense 3:4 portrait infographic poster using a fixed “natural specimen archive × modern museum guide plaque” layout system. It includes a header identification area, specimen-style image area, a central 3×3 grid with a core data radial chart, detailed key metrics, structural cross-section, spatial and temporal distribution, applications and user experience, side-by-side comparison, identification guide, preservation and maintenance, and historical lineage, plus a collection number and reference information area at the bottom. The layout, grid, typography, and color systems are consistent, making the posters easy to collect as a series. GPT Image 2 is used by default as the best-fit image generation model. Best for: building an account from scratch and taking commissioned work.
 Image
ImageViral Everything Infographic
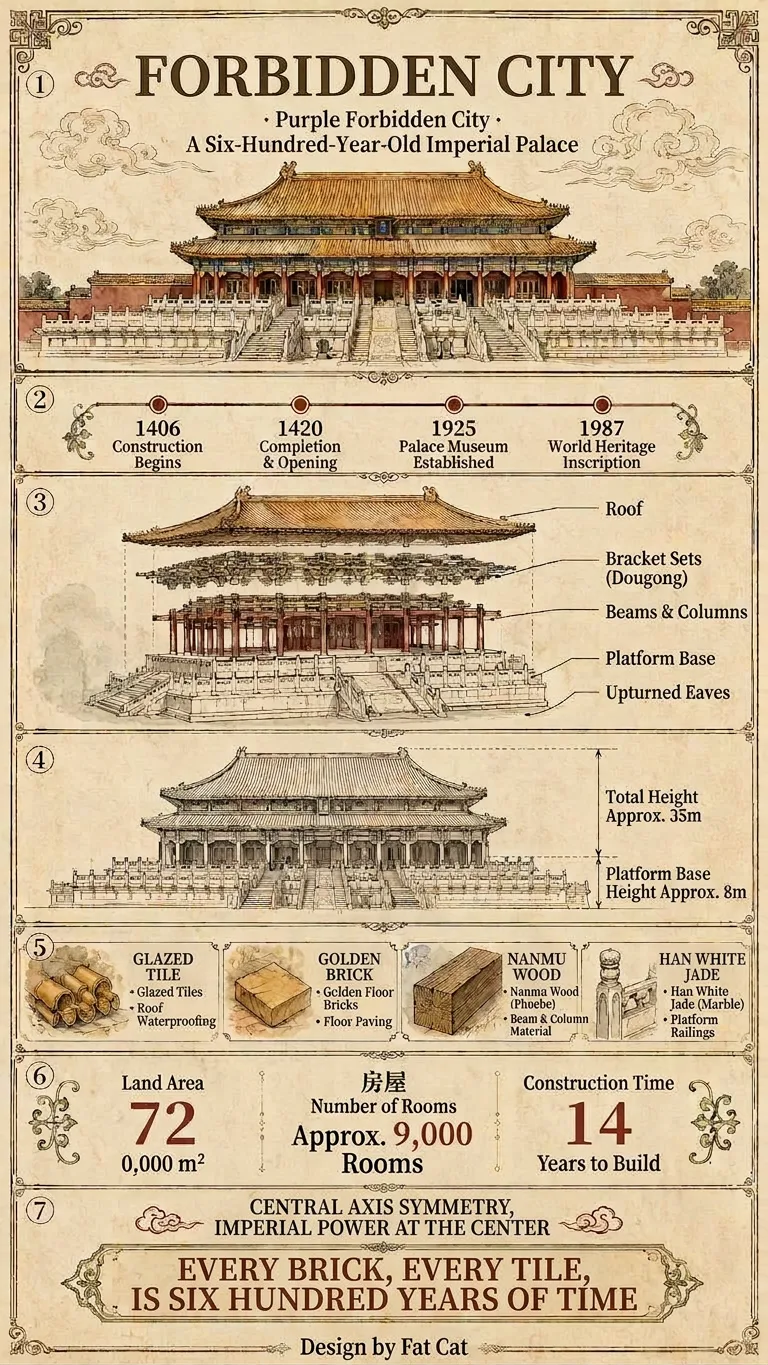
Enter a topic, and it will automatically identify the category, verify key facts online, and generate the copy. By default, it outputs a vertical, extra-long “Universal Deep-Dive” infographic (9:16) that explains “timeline · structure · diagrams · legend · data · humanities” in seven fixed sections. The diagrams adapt to the category: architecture gets engineering drawings, animals get anatomy and distribution maps, and people get relationship and achievement charts. When you need something lighter, you can switch to the “Standard Science” version (3:4). Both versions use the same style, fonts, colors, and borders, so they can be posted directly on Douyin or Xiaohongshu to start building your account.

Infographic Maker: 12 Styles
Input any content and generate professional infographics with one click. Supports 12 visual styles: tech futuristic, modern minimalist, comic narrative, vintage journal, thermal receipt, folder archive, classical retro, coordinate blueprint, white-background business, dark agent, ancient map, and comic storyboard. Automatically analyzes content structure to intelligently match chart, timeline, flowchart, and data card layouts. Outputs high-definition infographics.
Information
- Version
- v5
- Last updated
- Runtime credits
- Usage-based
- Models
- Auto
