
Yazai – Pro IP Visuals
Jacky's paper-blue Vox IP visuals
Yazai – Pro IP Visuals
Jacky's paper-blue Vox IP visuals
Showcase
Description
Automatically turn Chinese articles, tutorials, opinions, processes, and data into a consistent paper-blue Yazai visual style. It first selects a scene metaphor, knowledge diagram, or data visualization based on information density, then generates images suited to 16:9, 4:3, or vertical 3:4 formats. Use it for requests such as “article illustrations,” “knowledge diagrams,” “insight cards,” “flowcharts,” and “data visualizations.” You can also specify dimensions to design a visual cover.
Related Skills
View all Image
Viral Article Cover & Visual Generator
An AI visual design tool built specifically for content creators. Supports pasting article text directly, uploading PDF or Word documents, and inputting webpage links. AI automatically reads the article and distills its core themes and key points. Generate two high-definition images with one click: Viral Article Cover: Automatically extracts titles and designs engaging thematic visuals. Article Content Introduction: Combines stunning illustrations with text to showcase core viewpoints and key information. Flexibly choose between a 3:4 or 9:16 vertical aspect ratio. Supports multiple visual styles and personalized design requirements. No design experience required. No manual layout needed. Give every article a professional-grade visual presentation.

Professional Infographic Maker
Quickly transform complex information, data, and ideas into clear, professional, publication-ready infographics. Simply describe your topic, content, and purpose to generate visual outputs suitable for reports, marketing materials, presentations, internal documents, and social media without requiring any design experience. It supports common formats such as data visualizations, timelines, flowcharts, comparison charts, list summaries, geographic distributions, hierarchical structures, resumes, and social media graphics. It also matches visual styles to scenarios like enterprise, healthcare, technology, education, finance, and environmental protection. You can choose color schemes tailored to different audiences, including accessible palettes that are easier to read and considerate of color vision deficiencies. For content like market trends, industry statistics, scientific and medical information, or recent events, it can combine real-time research to supplement facts, figures, and background, helping reduce outdated or unsupported information. The generated results undergo quality checks focusing on layout hierarchy, text readability, data expression, color contrast, and overall communication effectiveness, with necessary optimizations for the use case. It is ideal for creating business report charts, product comparisons, project milestones, how-to guides, and social media content.
 Image
Visual Artist - XHS/DY/PPT
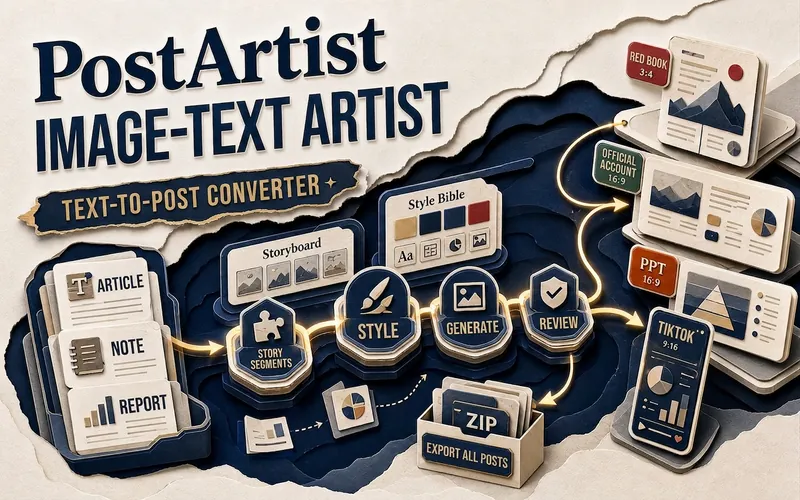
Turn long text into a series of images suitable for Douyin and Xiaohongshu with one click. Just provide your article, notes, or script; it will confirm information density, number of images, publishing platform, visual style, and account attribution, then automatically break down the content, generate storyboard scripts, and first produce a sample of the first image for your confirmation. Built-in templates include paper cutting, new fauvism, technical blueprint, information map, monograph, isometric map, stop-motion frame, and more, to quickly maintain a consistent style across the entire set of images. Suitable for knowledge bloggers, product operators, social media teams, and content creators, turning complex ideas into easier-to-read and more visually appealing graphic cards. Finally, output a complete image set and compressed package, transforming content production from 'editing and layout' into a clear, stable automated process.
Information
- Version
- v6
- Last updated
- Runtime credits
- Usage-based
- Models
- Auto