
Logistic Regression ROC-AUC
Interprets logistic regression with ROC-AUC
Logistic Regression ROC-AUC
Interprets logistic regression with ROC-AUC
Description
Turns your logistic regression analysis outputs (odds ratios, confidence intervals, and ROC-AUC) into an academic Findings section that can be added directly to a paper. Correctly classifies the ROC-AUC value according to standard benchmarks and avoids overstating results for non-significant variables. Suitable for researchers building clinical prediction models and graduate students.
Recommended by
Shuting@YouMind
Why we love this skill
Produces a publication-ready Results section from logistic regression outputs, with clinically accurate odds-ratio interpretation, appropriate caution for nonsignificant variables, and standard ROC-AUC classifications.
Showcase
Related Skills
View all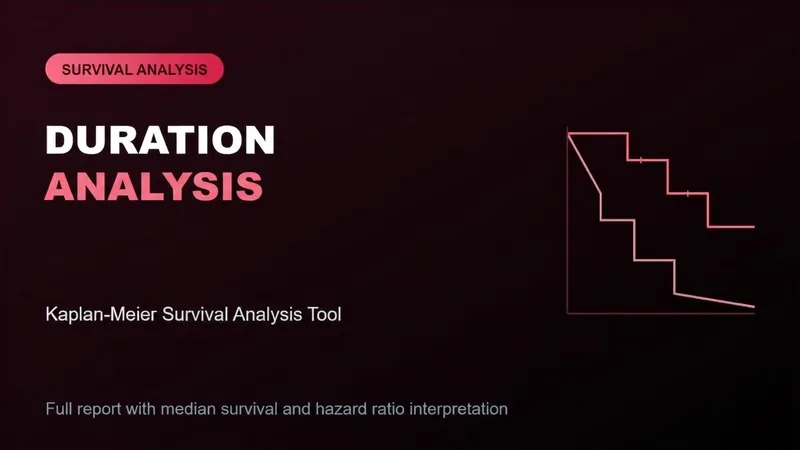 Research
Kaplan-Meier Report Writer
Generates a complete Methods + Results section from your Kaplan-Meier survival curves, log-rank tests, and Cox regression outputs. Correctly interprets hazard ratios, clearly notes when the censoring rate is high, and reminds you to check the proportional hazards assumption for the Cox model. Suitable for researchers working with clinical or epidemiological survival data.
 Research
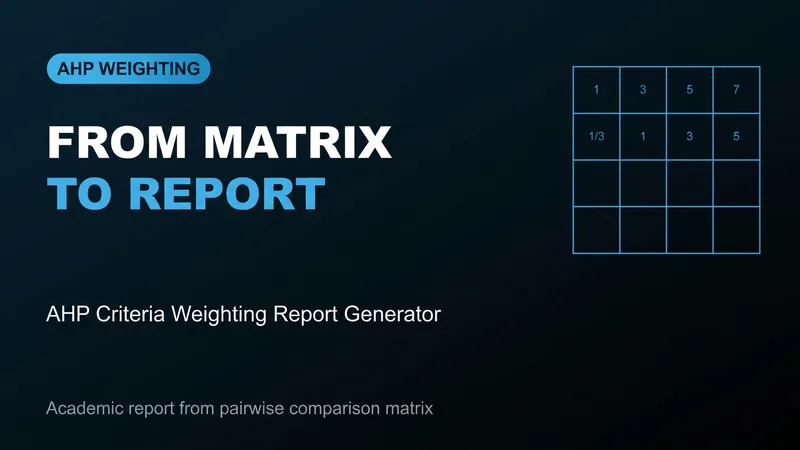
AHP Criterion Weighting Writer
Transforms the user's AHP (Analytic Hierarchy Process) pairwise comparison matrix outputs—criterion weights and consistency ratio—into an academic "Criterion Weighting" section that can be directly added to a paper. If the consistency ratio (CR) exceeds 0.10, it states this clearly without hiding it. Suitable for researchers and graduate students who use MCDM methods such as TOPSIS and VIKOR and determine criterion weights with AHP.
 Research
Descriptive Statistics Writer
Converts the user's descriptive statistics outputs (mean±SD or median(IQR), n(%)) into an academic "Participant Characteristics" paragraph that can be added directly to a paper, as well as a table in Table 1 format. Selects the correct descriptive statistic (mean±SD vs median(IQR)) based on normality and never mixes them up. Suitable for: graduate students and academics conducting quantitative research who want to write the "Participants" section of their paper quickly and accurately.