Physics Law Visualizer
Turn physics laws into clear visual cards
Physics Law Visualizer
Turn physics laws into clear visual cards
Showcase
Description
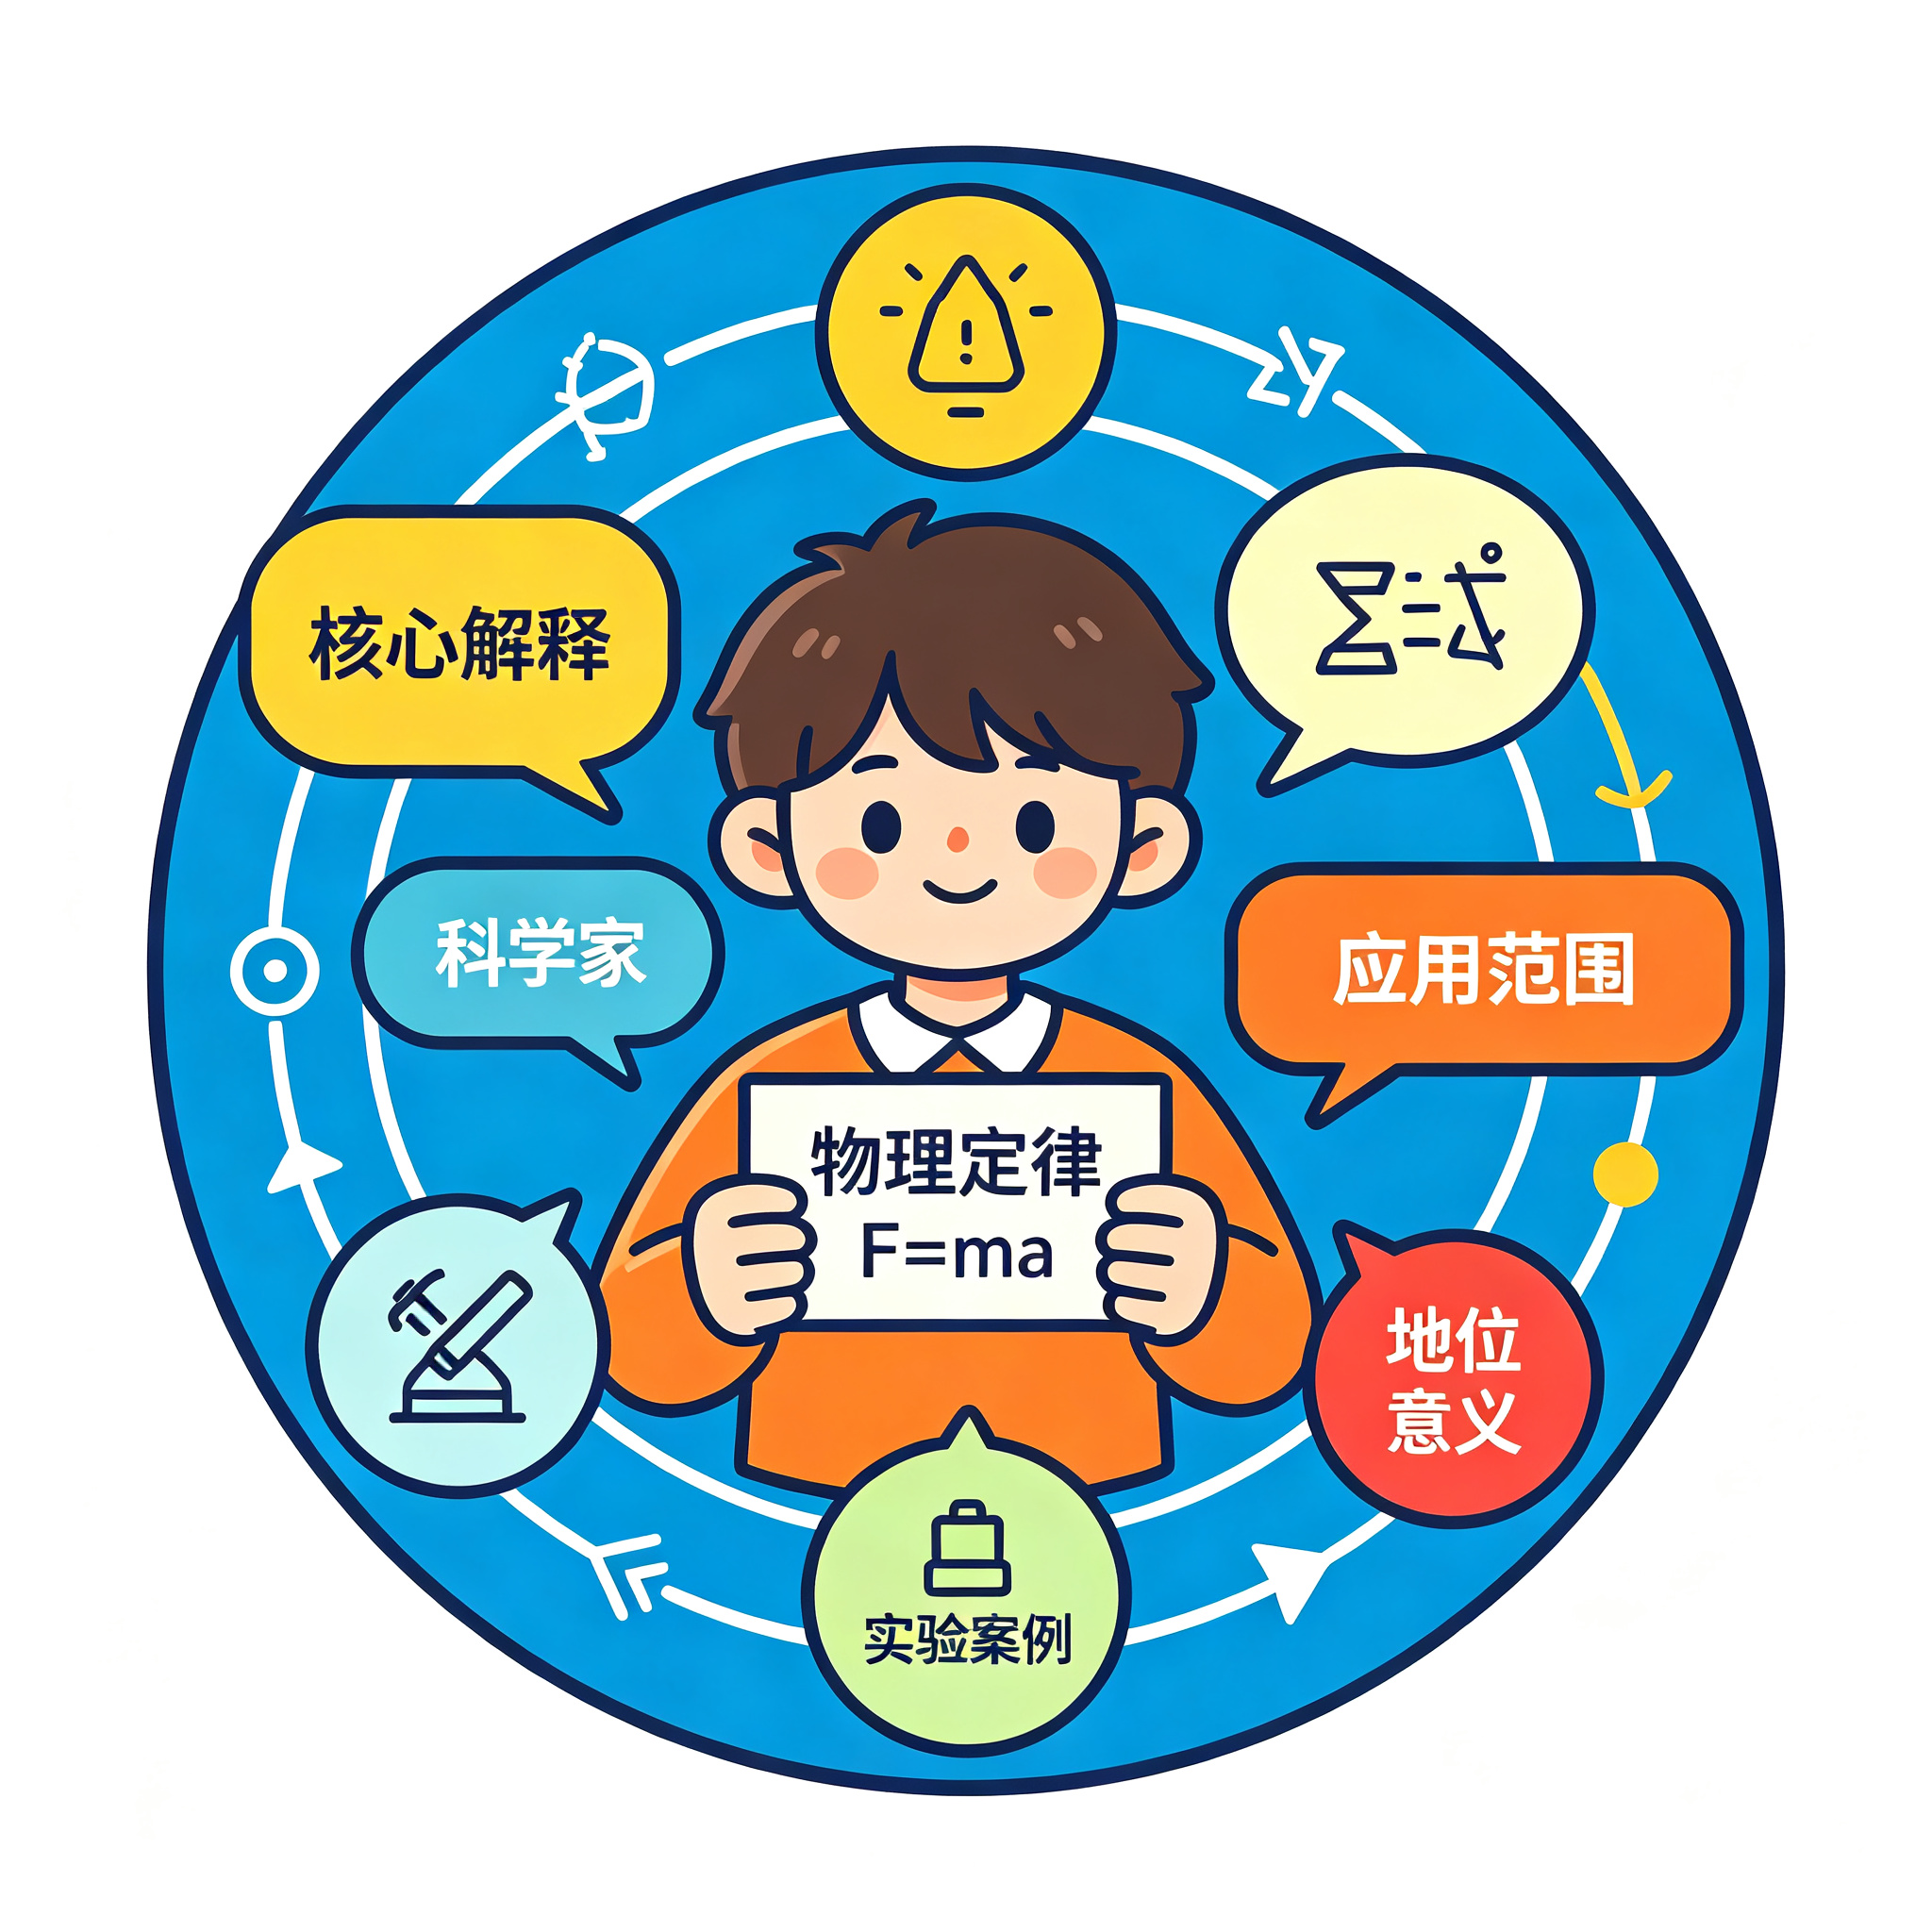
An AI-powered skill designed to create visual physics cards for students. Enter the name of a physics law to generate a vertical 3:4 panoramic infographic poster. The card features 6 fixed sections: core explanation, discoverer and era, mathematical formula, scope of application, real-life experiment examples, and significance. Combined with cartoon illustrations, diagrams, and connecting arrows, it visualizes abstract physics principles to make learning easier. It can also be expanded to create visual cards for science topics like chemistry and biology.
Recommended by
Dancang
Why we love this skill
Breaks down a physics law into a central title and six modules, combining formulas, proponents, application scope, real-life cases, and mnemonic tips to generate clear, easy-to-understand panoramic science infographics ideal for K-12 students.
Related Skills
View all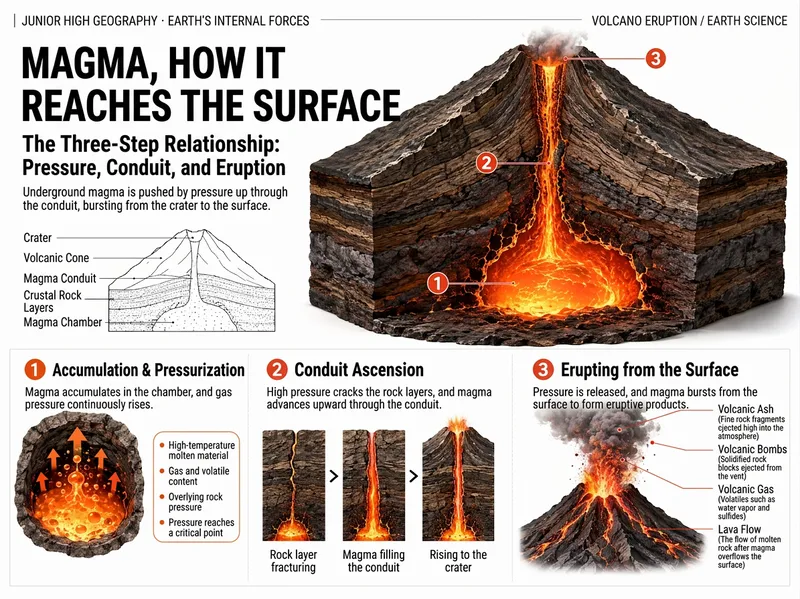 Image
3-Step Science Infographic Generator
Transform a middle or high school science topic into a landscape educational infographic that clearly explains a single process. It is suitable for middle and high school physics, chemistry, biology, and geography topics such as volcanic eruptions, photosynthesis, Ohm's law, plate tectonics, and buoyancy principles. Even with a broad topic, it narrows down to a specific process suitable for a single-image explanation. You will receive a clear variable table outlining the subject and textbook unit, core objects, core questions, three-step mechanism, structural terms, and outputs or results, based on which a fixed-layout infographic is generated. The content strictly focuses on one topic, organized into three stages: start, transfer or transformation, and end, connecting abstract principles to observable structures, substances, and causal relationships. The output features a pure white background, realistic 3D cross-sections combined with flat annotations in a textbook-matching style, including a title area, main visual, small diagrams, and a bottom three-column layout, using orange-red as the sole accent color. It is suitable for classroom projection, textbook illustrations, learning materials, and science infographics. The text, step numbers, structural labels, and physical positions in the image undergo a completeness check. The layout skeleton is fixed, allowing you to generate new images simply by changing the topic or specified text.
 Image
Classic Poem Visual Cards
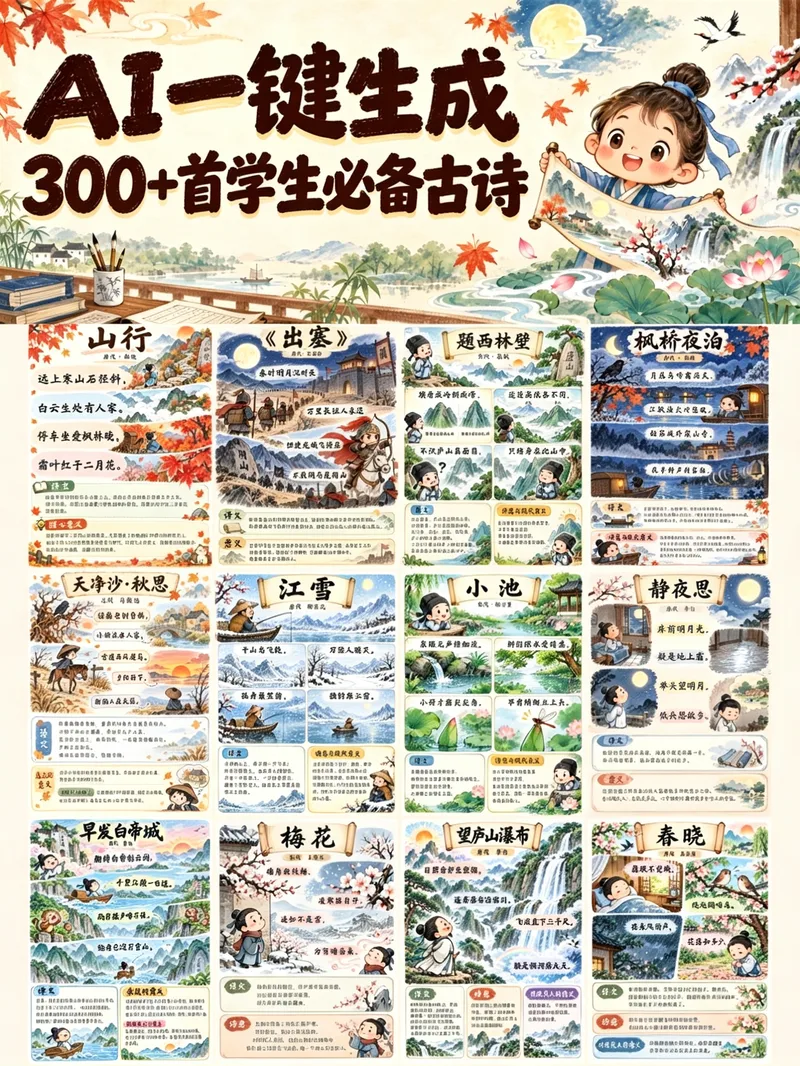
An AI-powered poem card generator designed specifically for elementary students. Enter the title of a poem to automatically generate a vertical 3:4 complete poster card. The card includes the poem title, dynasty, author, full text, scene illustrations matched to each line, translation, poetic meaning, and modern insights. Featuring cute chibi Chinese-style hand-drawn artwork, every line corresponds directly to an image, helping children build visual memory to memorize poems efficiently. It can also be expanded for creating cards on Song Ci poems, textbook texts, and idioms. Perfect for publishing image-and-text creations or posting on official accounts.
 Image
Viral Info Atlas Maker
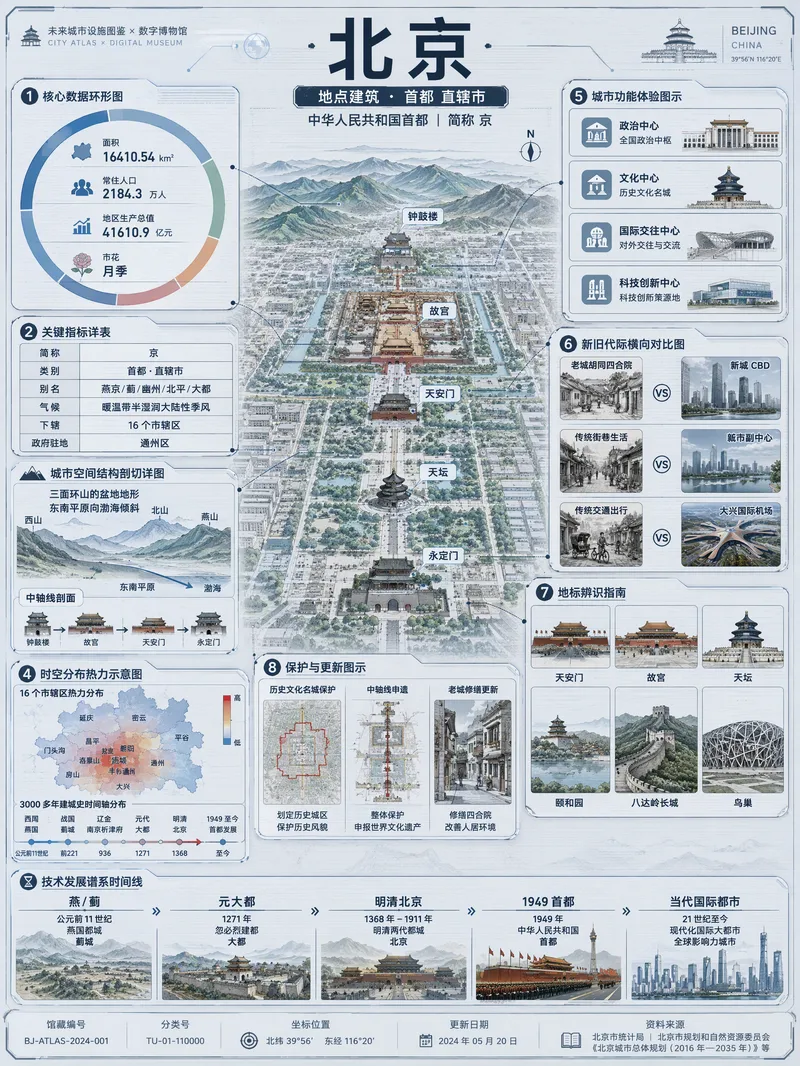
Quickly turn any subject name into a technology-inspired natural history atlas poster that combines rich information with strong visual appeal. Whether it’s a living thing, mineral or material, man-made object, place or building, cultural concept, or historical figure, the Skill organizes content for display and sharing based on your audience, focus, and language requirements. The Skill first uses real-time web research to verify definitions, key data, structure and composition, distribution, applications, evolution, identifying features, and more. It then arranges the content into a 3:4 vertical infographic. The poster centers on a specimen-style subject, surrounded by nine adaptive information modules covering core metrics, structural analysis, spatial and temporal distribution, context and use cases, comparisons, identification points, conservation or maintenance tips, and a development timeline. Module themes and information priorities are adjusted to fit the type of subject. The finished piece uses light gray-blue technical cardstock, precise linework, low-saturation cyan and blue washes, and a semi-transparent scanned texture. The result combines the visual style of a future-city infrastructure atlas with a digital museum display panel, while retaining the subject label at the top and a collection records area at the bottom. For obscure subjects or when information is limited, speculative content is distinguished with visual prompts. It is suitable for science education, exhibition introductions, knowledge sharing, and social media publishing.
Information
- Version
- v2
- Last updated
- Runtime credits
- Usage-based
- Models
- Auto