
Product Blueprint | Dual Maps
From vague needs to review-ready architecture
Product Blueprint | Dual Maps
From vague needs to review-ready architecture
Showcase
Description
Turn product ideas, PRDs, meeting notes, or documentation of an existing system into cross-validated product information architecture, core user flows, system context, and data flow diagrams. It also produces a product-to-system capability map, key risks, and open decisions. Ideal for product managers, founders, solution architects, and engineering teams conducting requirements reviews, planning SaaS/AI products, designing complex back-office systems, and modernizing existing systems. Supports Chinese and English input, prioritizes generating shareable responsive web pages, and preserves editable Mermaid source code.
Related Skills
View all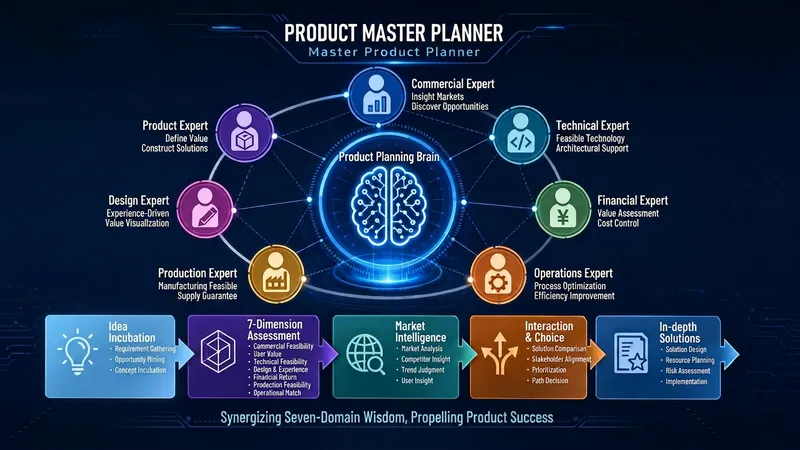
Master Product Planner
Based on the AFP architecture, this seven-dimensional product planning system integrates expertise from business, product, technology, design, finance, production, and operations to turn vague ideas into actionable product plans. Core capabilities: 1. Five-stage workflow: idea incubation → seven-dimensional expert evaluation (principles, methods, tools, practices) → market and competitive analysis → interactive selection → in-depth planning 2. Anti-AI hallucination engine: six defense lines (separating facts from inference, traceable sources, confidence labeling, locked expert boundaries, uncertainty statements, conflict marking) 3. Visual illustration: leverages the Create image skill to automatically embed graphics into the planning document 4. Three-core adversarial engine: execution core + audit core + user alignment core, with B-core audit weight set to Max 5. Pull interaction mode: AI proactively pulls key variables; the user only needs to provide materials or confirm choices Use cases: Transform pain points, ideas, or challenges into product plans, especially suitable for 0-to-1 planning of complex products (hardware-software integrated, platform-based, industry vertical). Trigger words: product planning, product plan, product concept, 0-to-1, MVP definition, product evaluation
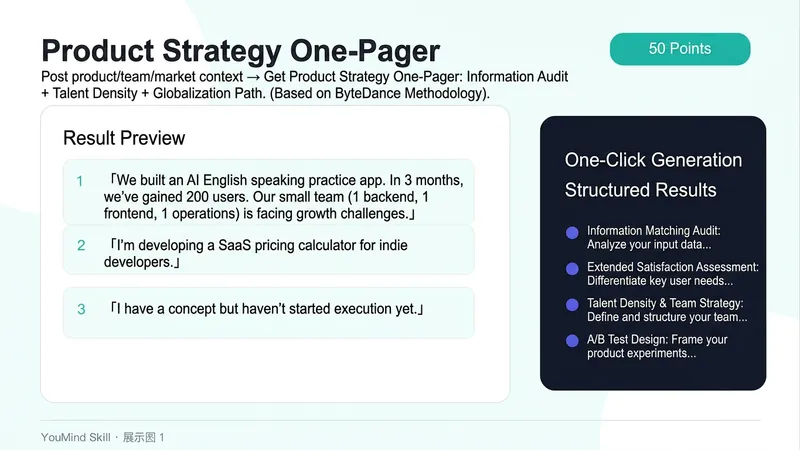
Product Strategy One-Pager
Building a product is like driving in the fog—what do users want? Is the team right? Should we go global? Which metric to optimize first? Every decision gambles the team's time and investors' money. Feed it your product info and data, and it uses ByteDance-style product methodology to help you clarify: What information and needs is your product matching? Are your current resources solving 'problems that will matter in three years' or 'urgent matters this month'? Is your team's talent density sufficient? What A/B tests can validate your core assumptions? ✨ Core Capabilities 1. Information match efficiency diagnosis: What is your product essentially matching? Where are the friction points? 2. Delayed gratification assessment: Distinguish 'important in three years' vs 'urgent this month', provide resource reallocation recommendations 3. Talent density and team strategy: Core role talent assessment + Context/Control boundary recommendations 4. A/B test design: Turn your gut assumptions into verifiable experimental plans 5. Global feasibility assessment: Language, culture, compliance, and payment four-dimensional check 📱 Use Cases - Early-stage startup teams making directional decisions - Product managers' quarterly reviews and strategy adjustments - Investors quickly evaluating a project's product logic - Developers building side projects validating ideas It doesn't give you a standard answer—it gives you a framework to ask the right questions.
 Image
Viral Infographic Maker
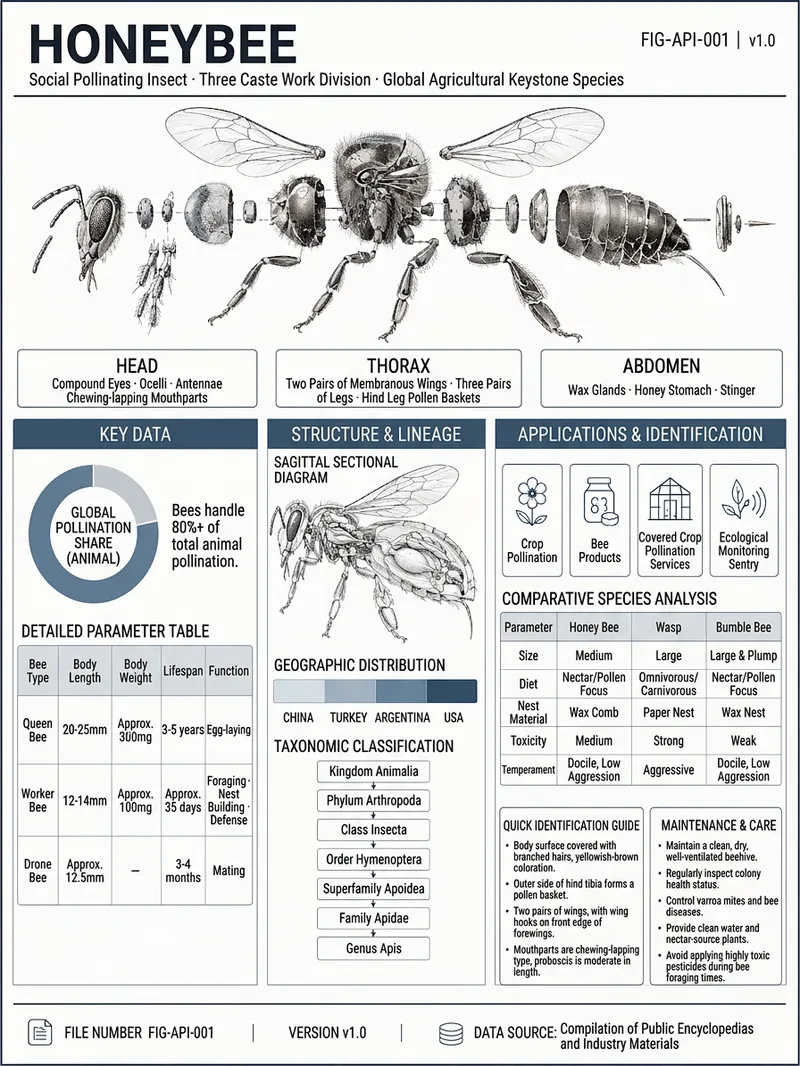
Enter an object name and any optional requirements to receive a research-verified reference infographic about it. Whether it is machinery, an electronic product, a living organism, a building, a vehicle, or a natural object, the system organizes its English name, field, key parameters, structural components, geographic or industry distribution, development lineage, use cases, comparisons with similar objects, identification points, and maintenance recommendations, while recording traceable data sources. Information that cannot be confirmed is clearly marked “Unverified.” The finished design uses a low-saturation gray-blue industrial drafting style, with an exploded view of the main subject and structural cross-section diagrams. Key data is presented as parameter tables, ring charts, distribution maps, lineage diagrams, and comparison panels to help readers quickly understand the object’s appearance, construction, performance, and applications. For abstract or data-based subjects, suitable geometric diagrams or data visualizations are used instead. The final deliverable is a strictly 3:4 infographic poster suitable for high-resolution viewing and print, along with an editable HTML source file. The layout includes title identification, main subject illustrations, structured information modules, and source notes, with a focus on complete content, clear text, and verifiable data.
Information
- Version
- v4
- Last updated
- Runtime credits
- Usage-based
- Models
- Auto