Rational Romance
Why we love this skill
This technique blends Swiss International Style, Neo-Bauhaus geometry, and simulated stencil printing aesthetics to create minimalist yet impactful visual works. Using a unique palette of deep brown, warm gray, and off-white, it transforms abstract concepts into geometric shapes, excelling particularly at showcasing the contrast between man and machine, nature and logic through the theme of "splitting," injecting a unique balance of rationality and romance into your designs.
Instructions
The author has set the instructions to private. Below is a brief overview.
description
The visuals embody the mindset of an engineer: calm, restrained, and focused on the essentials. Resonance: In a chaotic world, people crave the sense of security that order and logic provide.
Related Skills
View all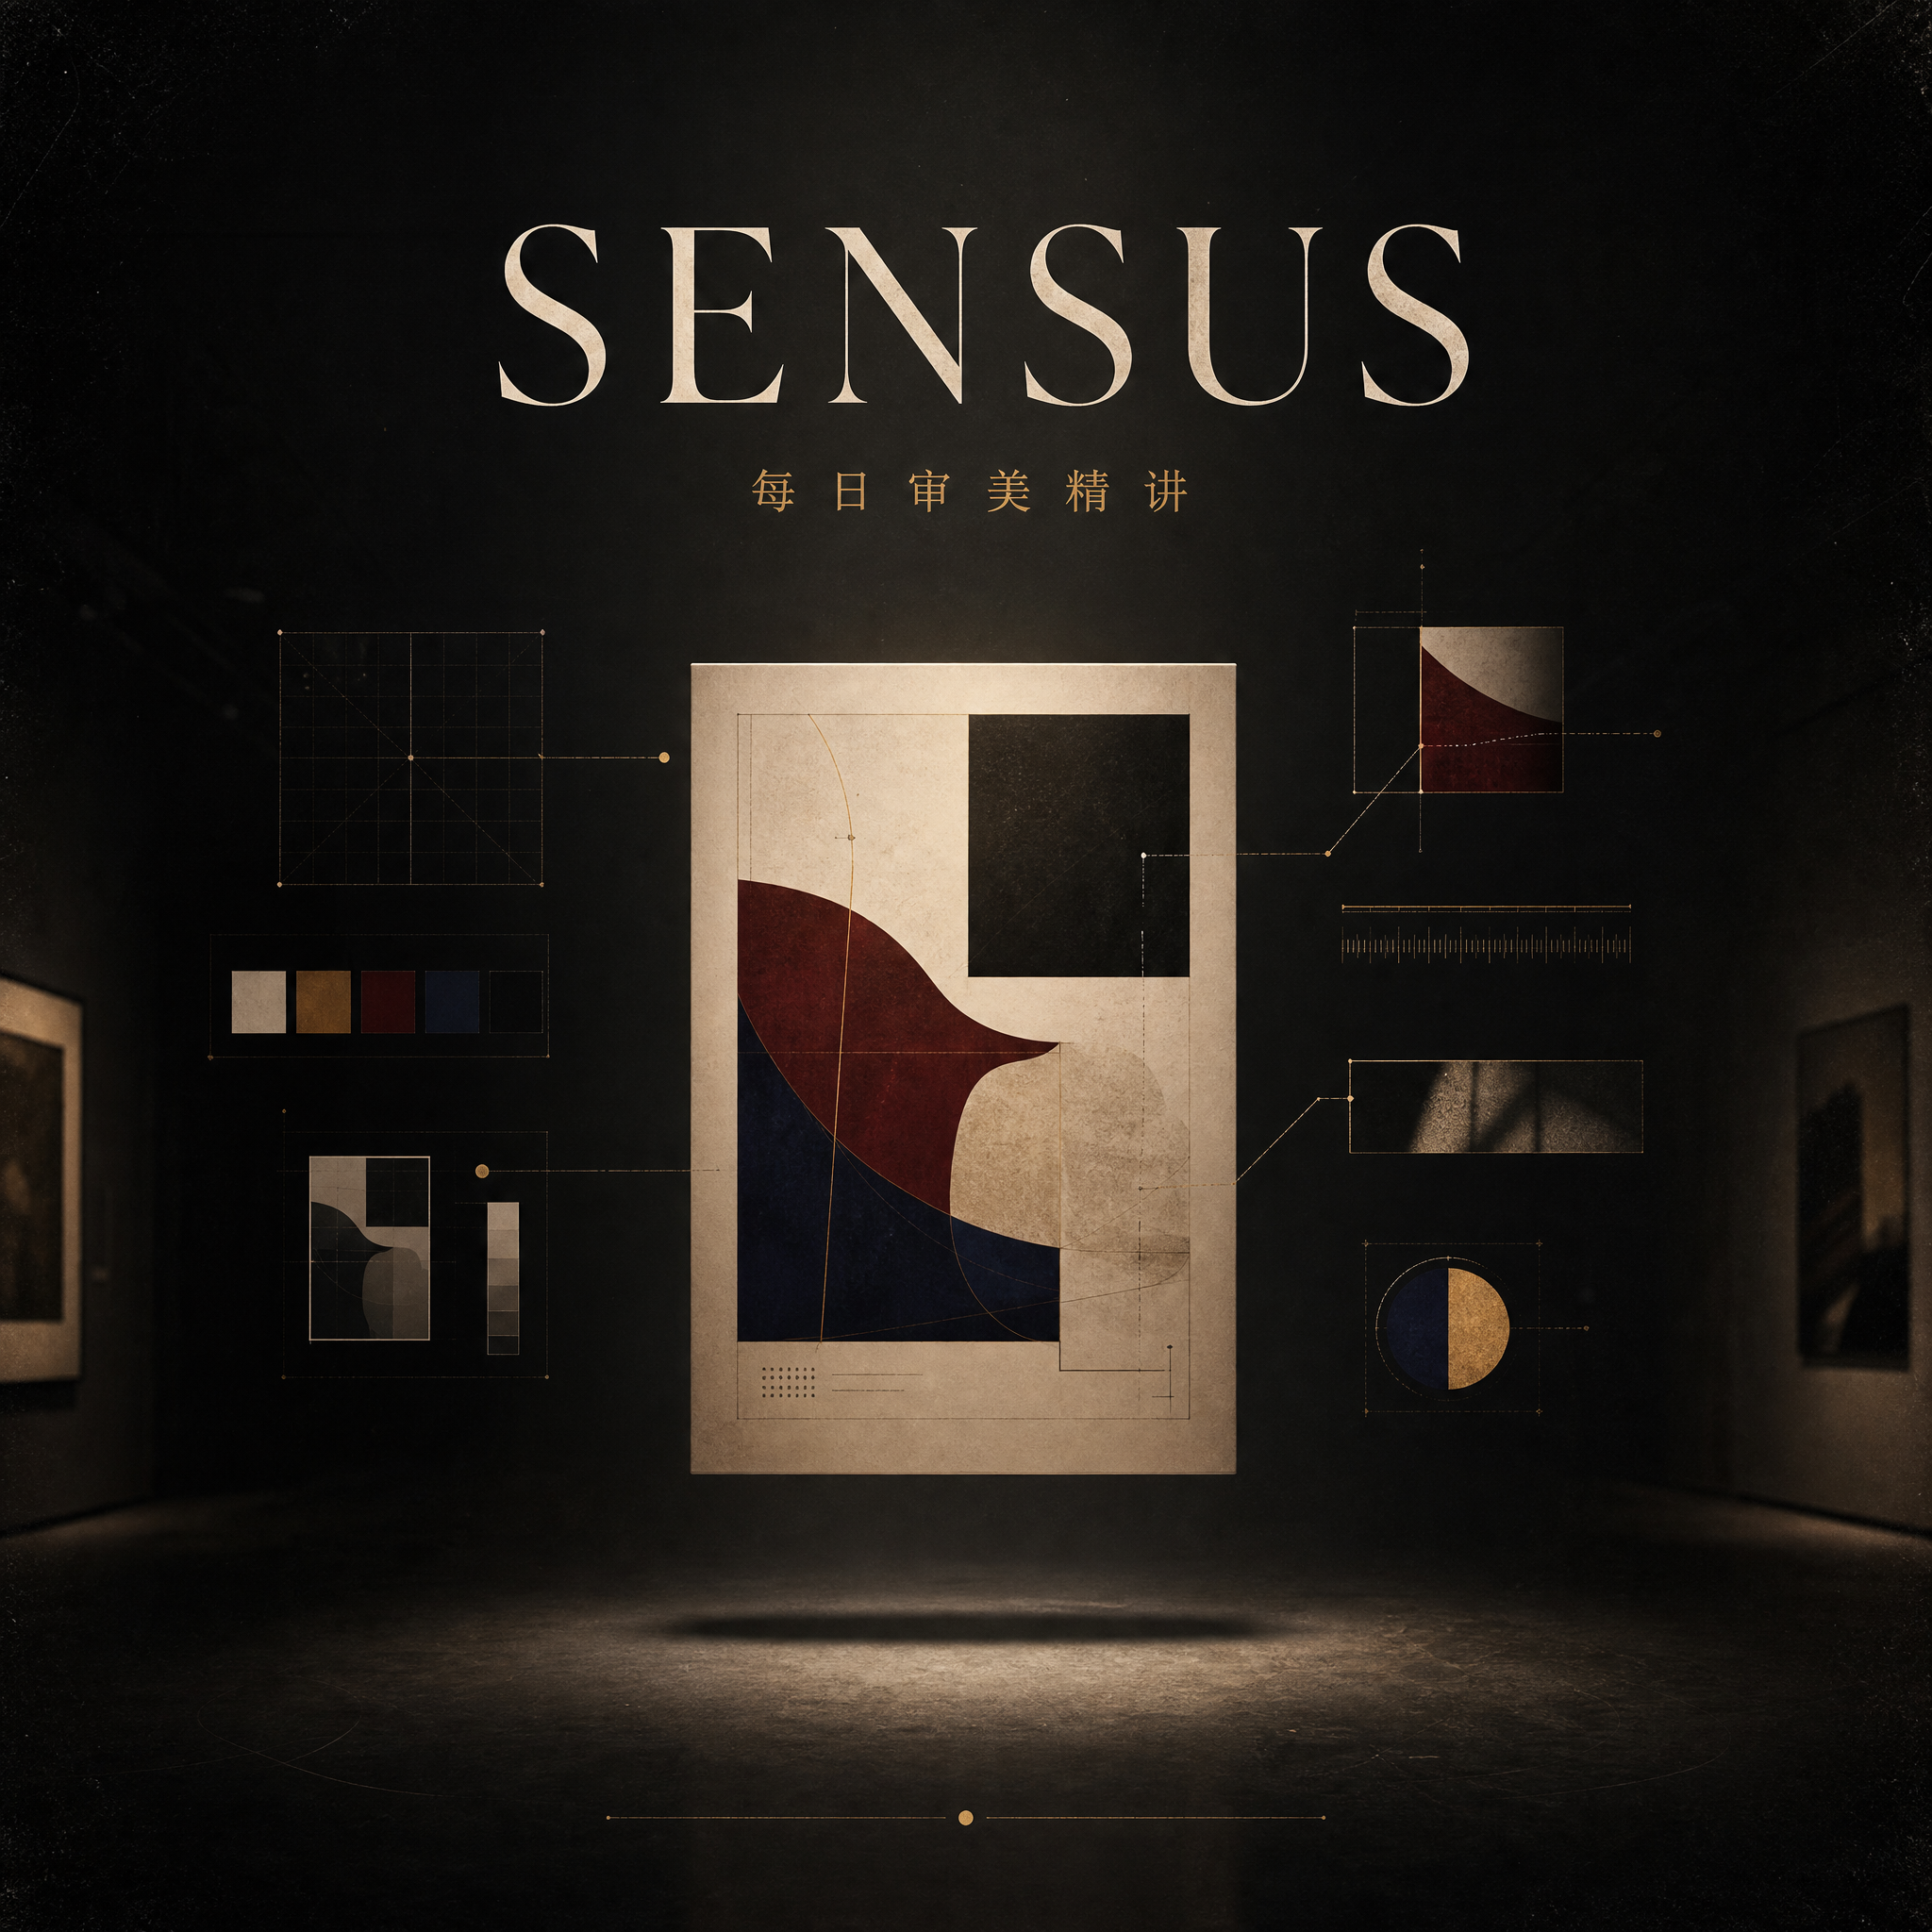
SENSUS Daily Aesthetic Insights
This skill aims to combine user-provided image materials with an aesthetic principle, deeply analyze their visual composition, and transform them into prompt templates and practical examples for use by AI image generation tools. It is suitable for designers, artists, content creators, and anyone wishing to improve their visual literacy and master AI image generation skills. Through this skill, users can submit image materials and specify an aesthetic theme, or allow AI to automatically deduce it based on the image content. The skill will conduct a detailed analysis of the image around the selected theme from multiple dimensions, including composition, color, emotion, and technique. Subsequently, based on the analysis results, it will generate a set of AI prompt templates containing English and Chinese explanations and variable descriptions, helping users understand how to translate abstract aesthetic principles into concrete AI instructions. Furthermore, this skill will utilize AI image generation technology to create new practical example images based on this template, providing detailed practical reviews, pointing out the accuracy and deviations of AI execution, and offering specific adjustment suggestions. Finally, all the analyzed and generated content will be presented in a clearly structured and professionally concise "Aesthetic Explanation" document, helping users deeply understand visual aesthetics and master practical methods for applying aesthetic concepts to AI creation.
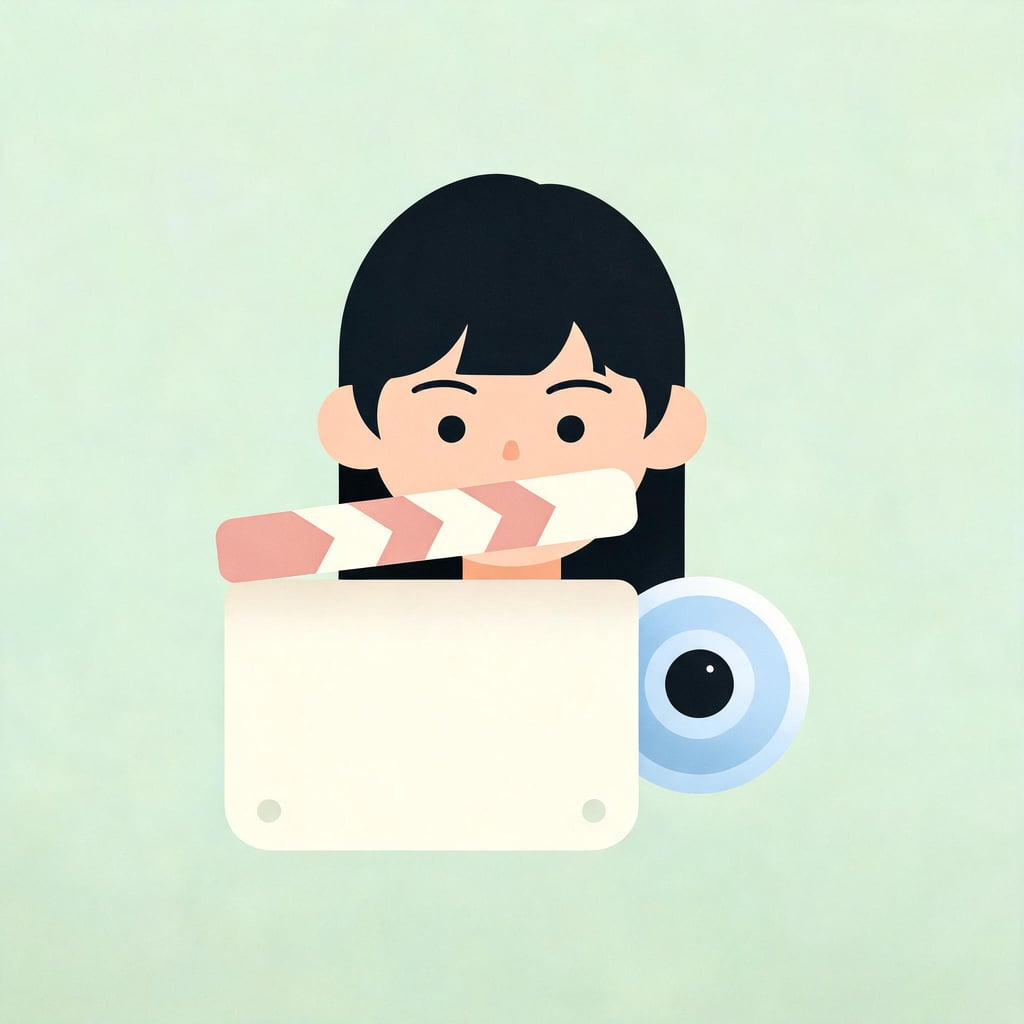
Asian Beauty Portrait Cue - Director's Instructions
This skill is designed for users who need to create high-quality portrait prompts for AI image generation platforms, especially suitable for creators and designers who pursue Asian aesthetics and mature, natural female images. It transforms your creative ideas into concrete, actionable prompts, ensuring the aesthetics of the generated images and platform compatibility. The core functions of this skill include: generating prompts suitable for various mainstream AI image models such as Midjourney, SDXL, Flux, GPT Image, Doubao, Jimeng, and ComfyUI, based on your description. It intelligently identifies and rewrites high-risk words, ensuring that the prompt content complies with platform safety guidelines and avoids childish, vulgar, or overly emphasizing body parts. Furthermore, you can quickly switch between different image styles using shortcuts, such as realistic selfies, commercial magazine spreads, high-end cosplay, cyberpunk, or classical Chinese style, and supports prompt repair based on feedback from failed generation attempts. Whether you want to create a fashion magazine cover, a cinematic portrait, or a 3D CG character design, this tool provides accurate language descriptions and parameter suggestions. The final output prompts will be optimized based on the selected platform. For example, it can generate natural and fluent English sentences for Midjourney, provide clear positive and negative keyword groups for SDXL/Flux, or provide detailed modular parameter slots for ComfyUI, helping you to efficiently generate AI portrait works that meet your expectations.
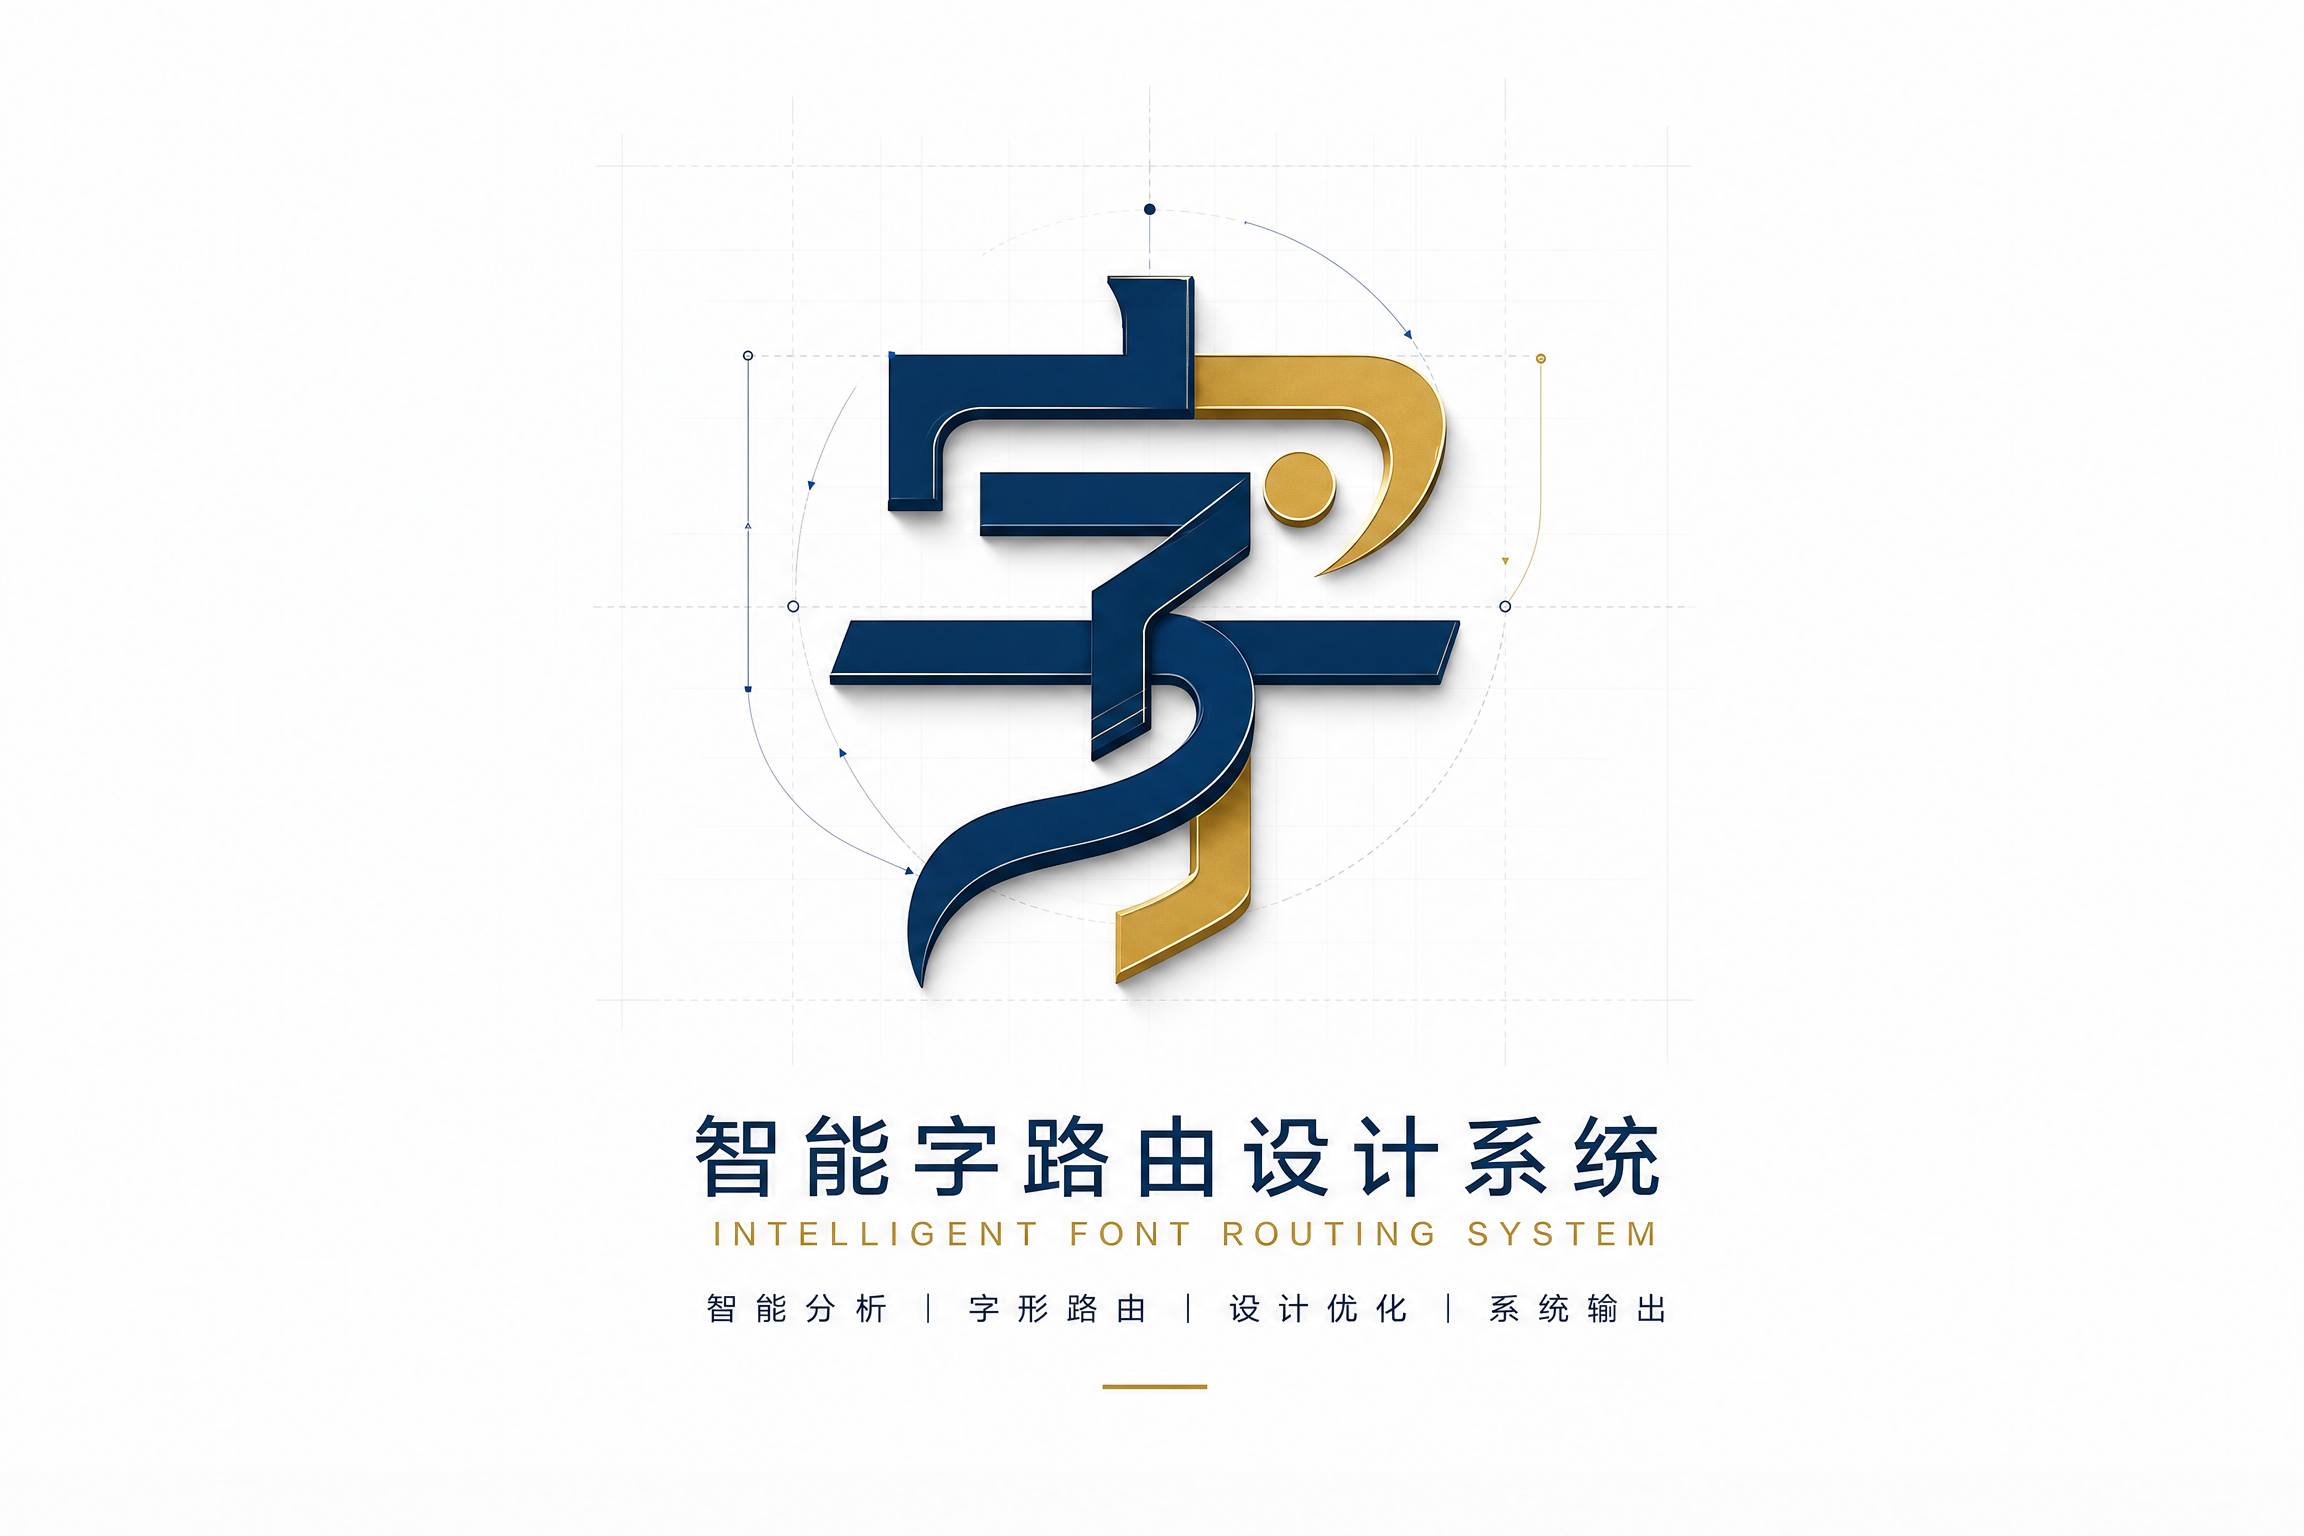
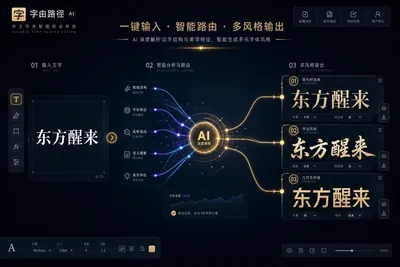
Chinese font design routing
Chinese Font Design Routing is a professional intelligent font design system that automatically converts Chinese phrases, titles, and brand names into professional font design directions and AI-generated image prompts. 🎯 Core Capabilities: • Intelligent Routing: Automatically analyzes the semantic energy of content (business/culture/emotion/technology) and matches the most suitable font design direction. • 160 Direction Matrix: 40 basic font routes × 4 variations = 160 professional directions. • 8 Designer Roles: Professional roles such as brand identity, editing and layout, commercial signs, cultural fonts, and experimental creativity. • Structured Features: No longer vague descriptions like "high-end" or "good-looking," but structured features of skeleton/strokes/edges/materials. • Quality Assurance: Each output comes with negative constraints and a verification checklist. ✨ Applicable Scenarios: Brand logo text, poster titles, product packaging, social media covers, event slogans, restaurant signs, cultural posters, game UI titles. This is not a static prompt word library, but an intelligent font design routing system that automatically selects the most suitable design direction based on content, scenario, and style.
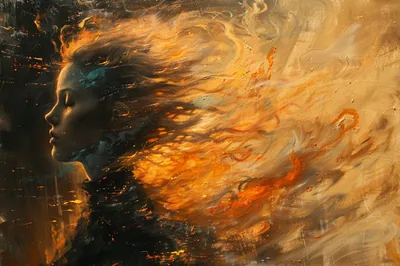
Rational Romance
Why we love this skill
This technique blends Swiss International Style, Neo-Bauhaus geometry, and simulated stencil printing aesthetics to create minimalist yet impactful visual works. Using a unique palette of deep brown, warm gray, and off-white, it transforms abstract concepts into geometric shapes, excelling particularly at showcasing the contrast between man and machine, nature and logic through the theme of "splitting," injecting a unique balance of rationality and romance into your designs.
Instructions
The author has set the instructions to private. Below is a brief overview.
description
The visuals embody the mindset of an engineer: calm, restrained, and focused on the essentials. Resonance: In a chaotic world, people crave the sense of security that order and logic provide.
Related Skills
View allSENSUS Daily Aesthetic Insights
This skill aims to combine user-provided image materials with an aesthetic principle, deeply analyze their visual composition, and transform them into prompt templates and practical examples for use by AI image generation tools. It is suitable for designers, artists, content creators, and anyone wishing to improve their visual literacy and master AI image generation skills. Through this skill, users can submit image materials and specify an aesthetic theme, or allow AI to automatically deduce it based on the image content. The skill will conduct a detailed analysis of the image around the selected theme from multiple dimensions, including composition, color, emotion, and technique. Subsequently, based on the analysis results, it will generate a set of AI prompt templates containing English and Chinese explanations and variable descriptions, helping users understand how to translate abstract aesthetic principles into concrete AI instructions. Furthermore, this skill will utilize AI image generation technology to create new practical example images based on this template, providing detailed practical reviews, pointing out the accuracy and deviations of AI execution, and offering specific adjustment suggestions. Finally, all the analyzed and generated content will be presented in a clearly structured and professionally concise "Aesthetic Explanation" document, helping users deeply understand visual aesthetics and master practical methods for applying aesthetic concepts to AI creation.
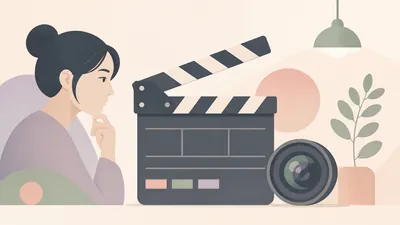
Asian Beauty Portrait Cue - Director's Instructions
This skill is designed for users who need to create high-quality portrait prompts for AI image generation platforms, especially suitable for creators and designers who pursue Asian aesthetics and mature, natural female images. It transforms your creative ideas into concrete, actionable prompts, ensuring the aesthetics of the generated images and platform compatibility. The core functions of this skill include: generating prompts suitable for various mainstream AI image models such as Midjourney, SDXL, Flux, GPT Image, Doubao, Jimeng, and ComfyUI, based on your description. It intelligently identifies and rewrites high-risk words, ensuring that the prompt content complies with platform safety guidelines and avoids childish, vulgar, or overly emphasizing body parts. Furthermore, you can quickly switch between different image styles using shortcuts, such as realistic selfies, commercial magazine spreads, high-end cosplay, cyberpunk, or classical Chinese style, and supports prompt repair based on feedback from failed generation attempts. Whether you want to create a fashion magazine cover, a cinematic portrait, or a 3D CG character design, this tool provides accurate language descriptions and parameter suggestions. The final output prompts will be optimized based on the selected platform. For example, it can generate natural and fluent English sentences for Midjourney, provide clear positive and negative keyword groups for SDXL/Flux, or provide detailed modular parameter slots for ComfyUI, helping you to efficiently generate AI portrait works that meet your expectations.
Chinese font design routing
Chinese Font Design Routing is a professional intelligent font design system that automatically converts Chinese phrases, titles, and brand names into professional font design directions and AI-generated image prompts. 🎯 Core Capabilities: • Intelligent Routing: Automatically analyzes the semantic energy of content (business/culture/emotion/technology) and matches the most suitable font design direction. • 160 Direction Matrix: 40 basic font routes × 4 variations = 160 professional directions. • 8 Designer Roles: Professional roles such as brand identity, editing and layout, commercial signs, cultural fonts, and experimental creativity. • Structured Features: No longer vague descriptions like "high-end" or "good-looking," but structured features of skeleton/strokes/edges/materials. • Quality Assurance: Each output comes with negative constraints and a verification checklist. ✨ Applicable Scenarios: Brand logo text, poster titles, product packaging, social media covers, event slogans, restaurant signs, cultural posters, game UI titles. This is not a static prompt word library, but an intelligent font design routing system that automatically selects the most suitable design direction based on content, scenario, and style.
Find your next favorite skill
Explore more curated AI skills for research, creation, and everyday work.