
AI研究用描画アドバイザー
学術図表5ステップ、7+1種マッチ、10種レイアウト、3段階プロンプト、道vs術・借vs造
説明
このスキルをおすすめする理由
学術図表生成に特化したスキル。独自の「道vs術」「借vs造」補正法で、7+1種の図表タイプと10種のレイアウトを正確にマッチングし、3段階のAI画像生成プロンプトをワンクリックで生成。研究図表作成の強力な味方です。
学術研究者のために作られたAI図表生成アドバイザーです。研究テーマや論文の一節を入力すると、コア変数や論理関係を自動解析し、7+1種類の学術図表タイプ(内容フレーム図、技術ロードマップ図、研究アイデア図、理論フレーム図、分析フレーム図、研究結論図、グラウンデッド・セオリー・モデル図)から正確にマッチングし、さらに10種類の構造レイアウト(線形フロー、閉ループサイクル、中心放射、マトリックス象限など)から最適なものを推奨します。最終的に、標準均衡、論理強調、視覚簡潔の3段階の完全なプロンプトを出力します。さらに「道vs術」と「借vs造」の二重の修正機能を内蔵しており、技術ロードマップ図と研究アイデア図を混同することがなくなります。
関連スキル
すべて表示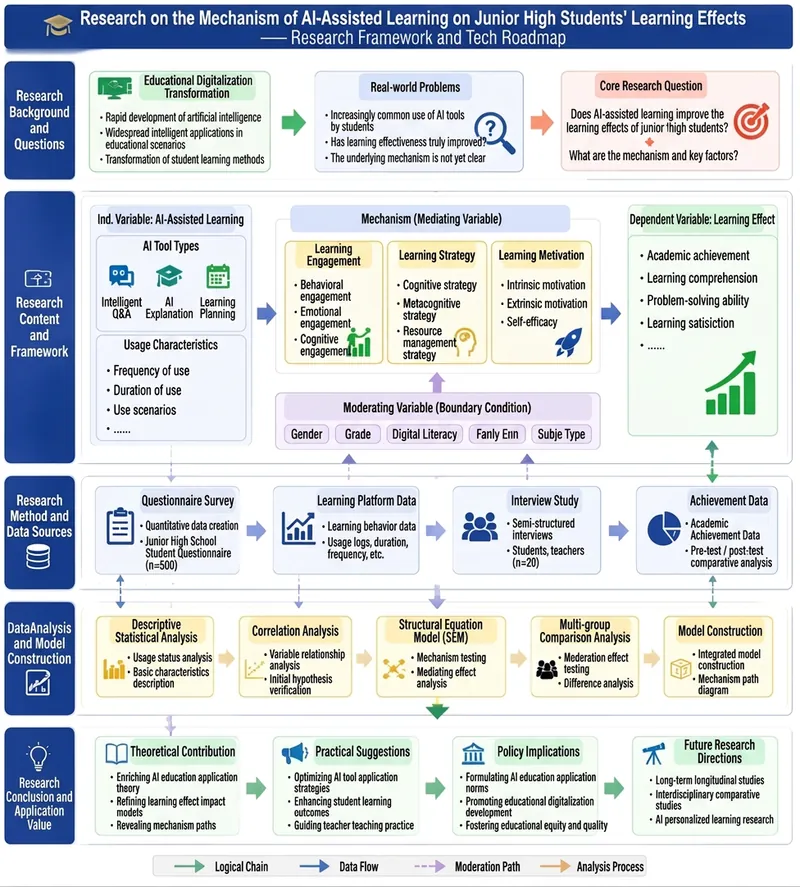
AI研究ロードマップデザイナー|プロ版
1ヶ月の文献調査や計画の手戻りを削減し、研究テーマを入力するだけで、発表や論文執筆に使える研究ロードマップを生成します。 研究テーマを入力すると、自動的に「研究フレームワーク図」「技術ロードマップ図」「論文ストーリーライン図」を生成します。 修士・博士・若手教員・研究者・基金申請者に適しています。 研究方向、研究対象、研究目標、研究方法、現在の課題を提供するだけで、以下の項目を整理します: ① 一言での研究ポジショニング ② 研究問題ツリー ③ 研究フレームワーク図 ④ 技術ロードマップ図 ⑤ 論文ストーリーライン図 ⑥ タイムライン図 ⑦ 最小卒業クロージング ⑧ AI描画に直接使えるプロンプト 特に以下の用途に最適: 研究計画書、中間審査、卒業論文、基金申請、SCI論文設計、課題申請。 論文を代わりに書くのではなく、混乱した研究アイデアを「指導教員が理解でき、自分で実行できる」技術ロードマップに整理します。
研究図表をワンクリック生成|フレーム図+ロードマップ
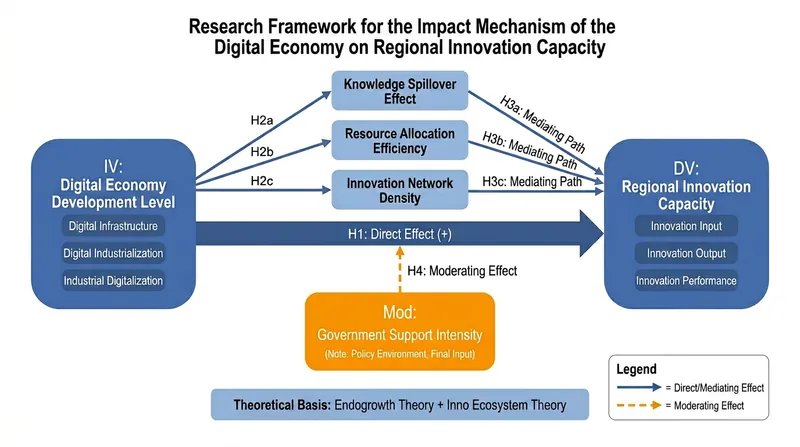
大学教員や図表の品質に高い要求を持つ方を対象 このスキルは、課題申請の図表、教学ケースの図表、論文論証の図表などをワンクリックで直接出力します 使い始めたら手放せなくなる可視化ツールです。 テーマと研究情報を入力すると、AIがダウンロード可能な高画質画像添付ファイルを直接生成します。以下のスタイルに限りません: • 研究フレーム図:三欄レイアウト(研究アプローチ|研究内容|研究方法)、学術規範に沿った組版 • 技術ロードマップ:多段階フローチャート、方法ツール、イノベーションポイントの注釈、時間計画を含む • 変数関係図:IV→MV→DV パス、H1-H4 仮説番号、青灰色の学術配色 適用分野:新聞・メディア、教育学、管理学、理工学など 出力:画像添付ファイルを直接生成、申請書やPPTなどに埋め込み可能

人文社会科学の学術図表作成
このスキルは人文社会科学の研究者向けに設計されており、学術出版に利用可能な高品質なAI生成プロンプトを作成します。理論枠組み図、概念関係図、研究デザインフローチャート、作用メカニズム図、影響経路図、多次元統合分析フレームワーク、比較研究図、歴史的変遷タイムライン、ステークホルダーネットワーク図、プロジェクト提案論証図の10種類のコア図表をカバーしています。SSCI/CSSCIジャーナル論文、学位論文、政策報告書、プロジェクト申請書の表紙図など、あらゆる作成に対応します。 ユーザーは研究テーマと図表の種類を提供するだけで、本スキルが自動的に内容を補完し、中国語と英語のバイリンガルプロンプトを生成します。図表の学術的厳密性を重視し、生成されるすべての画像は実体図を主体とし、簡潔な英語ラベルと3D質感を採用し、装飾要素を厳格に排除します。 スタイル面では、「国内向け」と「国際向け」の2つのモードを提供します。国内向け(Track A)はCSSCIジャーナルや国家社会科学基金プロジェクトなどに対応し、白黒印刷対応と装飾ゼロを重視します。国際向け(Track B)はSSCI/SCIジャーナルなどに対応し、低彩度の機能的なカラーを使用し、グレースケールでも明瞭に読み取れるよう設計されています。このデュアルトラック設計により、国内の学術規範にも国際的な出版基準にも適合した図表を実現し、研究成果を最も専門的かつ明確な形で提示します。
AI研究用描画アドバイザー
学術図表5ステップ、7+1種マッチ、10種レイアウト、3段階プロンプト、道vs術・借vs造
説明
このスキルをおすすめする理由
学術図表生成に特化したスキル。独自の「道vs術」「借vs造」補正法で、7+1種の図表タイプと10種のレイアウトを正確にマッチングし、3段階のAI画像生成プロンプトをワンクリックで生成。研究図表作成の強力な味方です。
学術研究者のために作られたAI図表生成アドバイザーです。研究テーマや論文の一節を入力すると、コア変数や論理関係を自動解析し、7+1種類の学術図表タイプ(内容フレーム図、技術ロードマップ図、研究アイデア図、理論フレーム図、分析フレーム図、研究結論図、グラウンデッド・セオリー・モデル図)から正確にマッチングし、さらに10種類の構造レイアウト(線形フロー、閉ループサイクル、中心放射、マトリックス象限など)から最適なものを推奨します。最終的に、標準均衡、論理強調、視覚簡潔の3段階の完全なプロンプトを出力します。さらに「道vs術」と「借vs造」の二重の修正機能を内蔵しており、技術ロードマップ図と研究アイデア図を混同することがなくなります。
関連スキル
すべて表示AI研究ロードマップデザイナー|プロ版
1ヶ月の文献調査や計画の手戻りを削減し、研究テーマを入力するだけで、発表や論文執筆に使える研究ロードマップを生成します。 研究テーマを入力すると、自動的に「研究フレームワーク図」「技術ロードマップ図」「論文ストーリーライン図」を生成します。 修士・博士・若手教員・研究者・基金申請者に適しています。 研究方向、研究対象、研究目標、研究方法、現在の課題を提供するだけで、以下の項目を整理します: ① 一言での研究ポジショニング ② 研究問題ツリー ③ 研究フレームワーク図 ④ 技術ロードマップ図 ⑤ 論文ストーリーライン図 ⑥ タイムライン図 ⑦ 最小卒業クロージング ⑧ AI描画に直接使えるプロンプト 特に以下の用途に最適: 研究計画書、中間審査、卒業論文、基金申請、SCI論文設計、課題申請。 論文を代わりに書くのではなく、混乱した研究アイデアを「指導教員が理解でき、自分で実行できる」技術ロードマップに整理します。
研究図表をワンクリック生成|フレーム図+ロードマップ
大学教員や図表の品質に高い要求を持つ方を対象 このスキルは、課題申請の図表、教学ケースの図表、論文論証の図表などをワンクリックで直接出力します 使い始めたら手放せなくなる可視化ツールです。 テーマと研究情報を入力すると、AIがダウンロード可能な高画質画像添付ファイルを直接生成します。以下のスタイルに限りません: • 研究フレーム図:三欄レイアウト(研究アプローチ|研究内容|研究方法)、学術規範に沿った組版 • 技術ロードマップ:多段階フローチャート、方法ツール、イノベーションポイントの注釈、時間計画を含む • 変数関係図:IV→MV→DV パス、H1-H4 仮説番号、青灰色の学術配色 適用分野:新聞・メディア、教育学、管理学、理工学など 出力:画像添付ファイルを直接生成、申請書やPPTなどに埋め込み可能
人文社会科学の学術図表作成
このスキルは人文社会科学の研究者向けに設計されており、学術出版に利用可能な高品質なAI生成プロンプトを作成します。理論枠組み図、概念関係図、研究デザインフローチャート、作用メカニズム図、影響経路図、多次元統合分析フレームワーク、比較研究図、歴史的変遷タイムライン、ステークホルダーネットワーク図、プロジェクト提案論証図の10種類のコア図表をカバーしています。SSCI/CSSCIジャーナル論文、学位論文、政策報告書、プロジェクト申請書の表紙図など、あらゆる作成に対応します。 ユーザーは研究テーマと図表の種類を提供するだけで、本スキルが自動的に内容を補完し、中国語と英語のバイリンガルプロンプトを生成します。図表の学術的厳密性を重視し、生成されるすべての画像は実体図を主体とし、簡潔な英語ラベルと3D質感を採用し、装飾要素を厳格に排除します。 スタイル面では、「国内向け」と「国際向け」の2つのモードを提供します。国内向け(Track A)はCSSCIジャーナルや国家社会科学基金プロジェクトなどに対応し、白黒印刷対応と装飾ゼロを重視します。国際向け(Track B)はSSCI/SCIジャーナルなどに対応し、低彩度の機能的なカラーを使用し、グレースケールでも明瞭に読み取れるよう設計されています。このデュアルトラック設計により、国内の学術規範にも国際的な出版基準にも適合した図表を実現し、研究成果を最も専門的かつ明確な形で提示します。
次のお気に入りスキルを見つけよう
リサーチ、制作、日々の作業に役立つ厳選AIスキルをさらに探しましょう。