Every Classic-Modern Conflict Cover
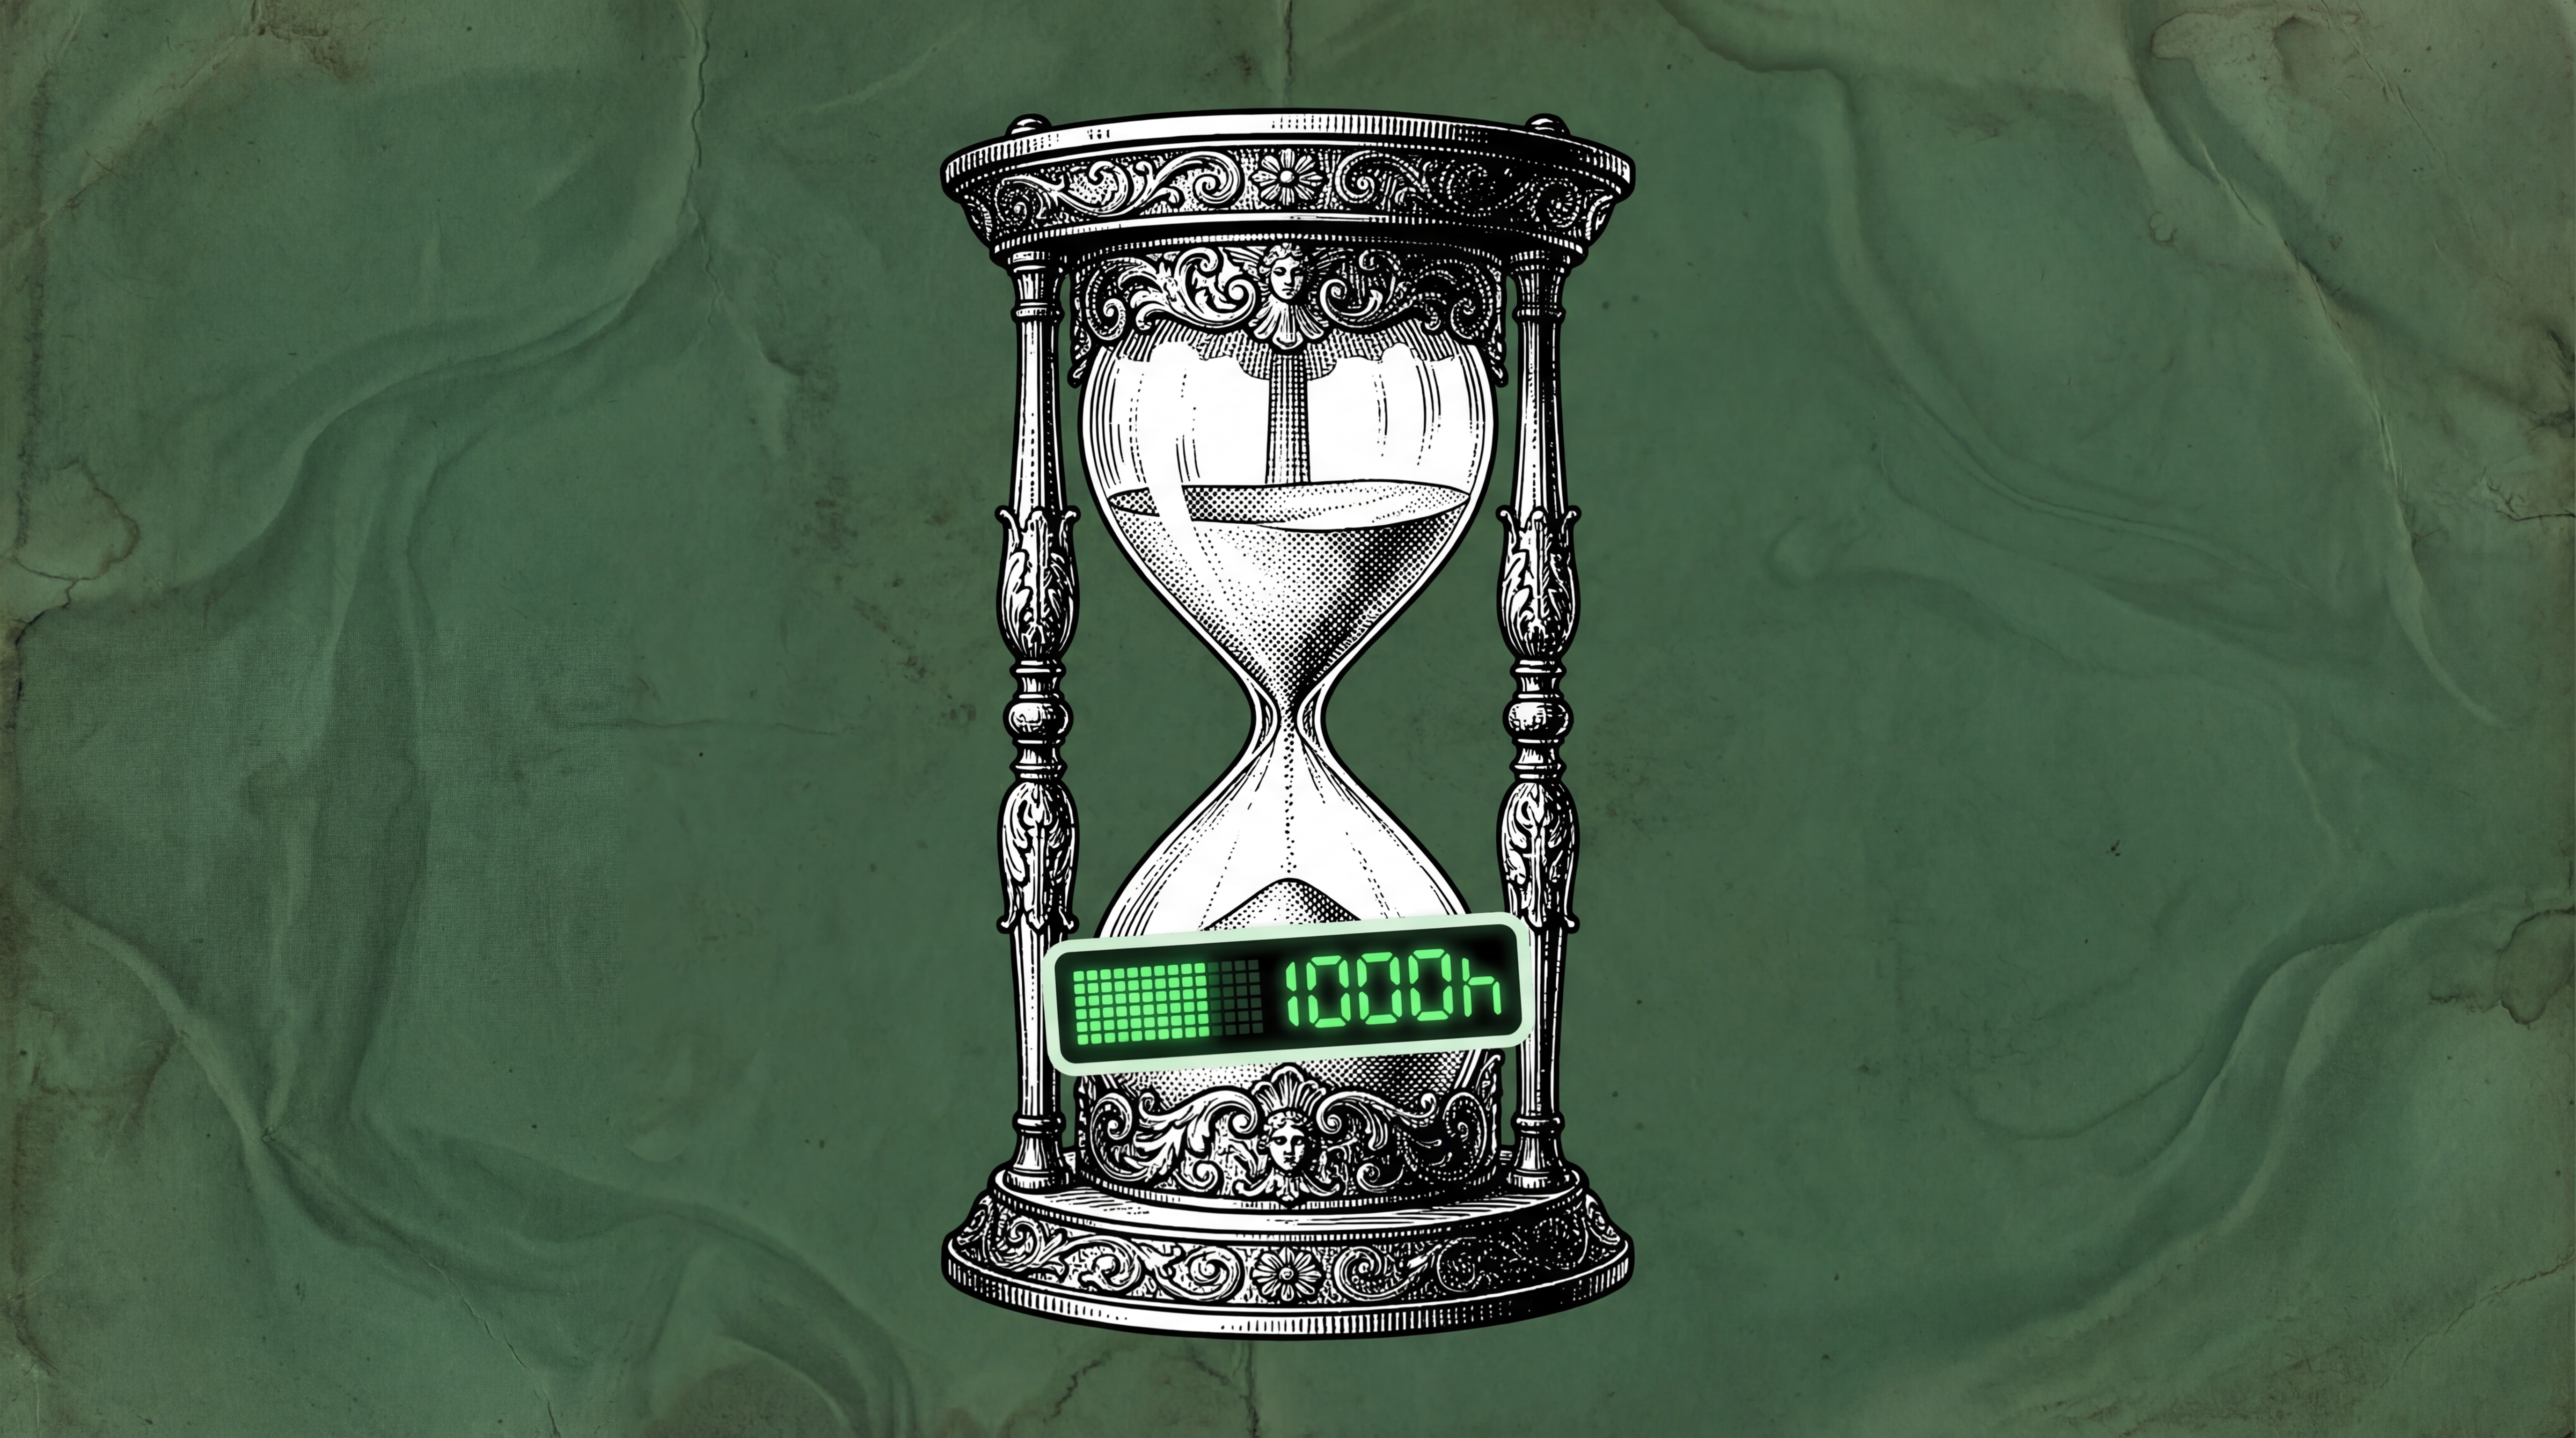
The article's core ideas are transformed into a visual impact. The collision of classical engraving and modern symbols creates the Every.to-style cover, characterized by dark emphasis, high contrast, wordless composition, and a strong sense of artistry.
Featured by
nene@YouMind.AI
Why we love this skill
This skill, with its unique aesthetic of contrasting classic and modern elements, cleverly blends traditional woodblock printing with contemporary elements to create magazine covers with a strong visual impact.
Instructions
Read the article above. Based on the core idea of the article, choose a specific physical object as a visual metaphor and insert a modern element that strongly conflicts with it (classical engraving object × contemporary symbol or brand, the stronger the conflict, the better).
Choose a dark accent color.
Generate Every.to magazine-style cover illustrations: engraving style, dotted halftone textures, 19th-century woodcut aesthetics, with a large area of solid color on the background ([accuracy color]), and a slight aged effect should be highlighted on the background.
The background color itself has slight variations in shade, which can create ripples, lines, or flowing patterns. The black and white main body is accented with accent colors, resulting in high contrast.
Centered composition, full-page crop, no text, aspect ratio 16:9
Related Skills
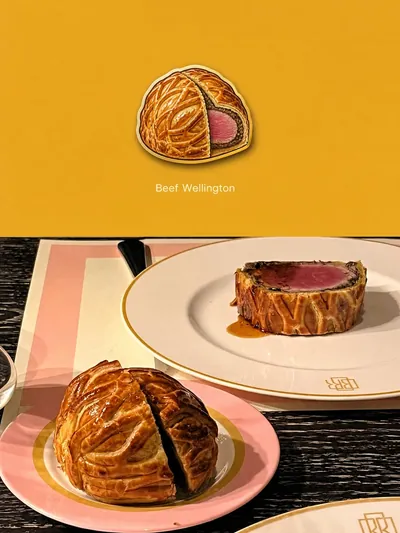
View allTravel Fridge Magnet Poster
Generate a vertically split travel photography poster with a minimalist fridge magnet–style icon from a user's photo, featuring solid-color background and optional text overlay.
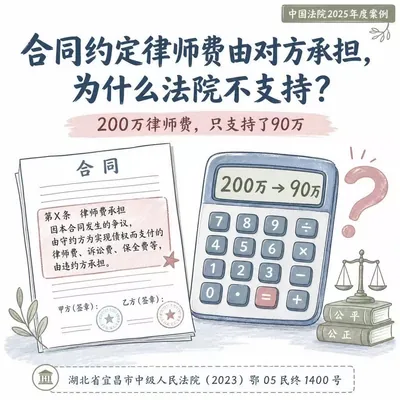
Lawyer's WeChat Moments Nine-Grid Generator
This tool generates professional nine-grid images for lawyers' WeChat Moments, using a narrative structure of case studies and advice to create a sense of urgency for potential clients, leading them to consult on legal issues. It supports customized lawyer information and avatars, employing a whiteboard-style hand-drawn design to avoid legal lecturing and connect with clients through empathetic language. This skill has already helped me achieve continuous monetization. Its logic can also be applied to similar professionals, independent practitioners, and those who need to acquire clients.
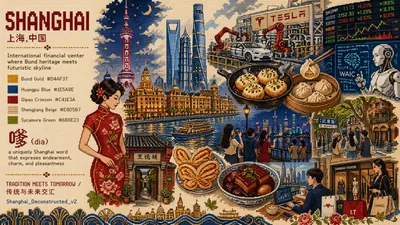
City Culture Pixel Mood Generator
Generate pixel art-style cultural mood posters for any city worldwide, deeply deconstructing urban culture. Present the true character of a city with 8-bit embroidery patchwork aesthetics, using pixel embroidery collage to generate a "cultural mood" poster for any city. Input the city name, and get a pixel mood poster with soul.
Every Classic-Modern Conflict Cover
The article's core ideas are transformed into a visual impact. The collision of classical engraving and modern symbols creates the Every.to-style cover, characterized by dark emphasis, high contrast, wordless composition, and a strong sense of artistry.
Featured by
nene@YouMind.AI
Why we love this skill
This skill, with its unique aesthetic of contrasting classic and modern elements, cleverly blends traditional woodblock printing with contemporary elements to create magazine covers with a strong visual impact.
Instructions
Read the article above. Based on the core idea of the article, choose a specific physical object as a visual metaphor and insert a modern element that strongly conflicts with it (classical engraving object × contemporary symbol or brand, the stronger the conflict, the better).
Choose a dark accent color.
Generate Every.to magazine-style cover illustrations: engraving style, dotted halftone textures, 19th-century woodcut aesthetics, with a large area of solid color on the background ([accuracy color]), and a slight aged effect should be highlighted on the background.
The background color itself has slight variations in shade, which can create ripples, lines, or flowing patterns. The black and white main body is accented with accent colors, resulting in high contrast.
Centered composition, full-page crop, no text, aspect ratio 16:9
Related Skills
View allTravel Fridge Magnet Poster
Generate a vertically split travel photography poster with a minimalist fridge magnet–style icon from a user's photo, featuring solid-color background and optional text overlay.
Lawyer's WeChat Moments Nine-Grid Generator
This tool generates professional nine-grid images for lawyers' WeChat Moments, using a narrative structure of case studies and advice to create a sense of urgency for potential clients, leading them to consult on legal issues. It supports customized lawyer information and avatars, employing a whiteboard-style hand-drawn design to avoid legal lecturing and connect with clients through empathetic language. This skill has already helped me achieve continuous monetization. Its logic can also be applied to similar professionals, independent practitioners, and those who need to acquire clients.
City Culture Pixel Mood Generator
Generate pixel art-style cultural mood posters for any city worldwide, deeply deconstructing urban culture. Present the true character of a city with 8-bit embroidery patchwork aesthetics, using pixel embroidery collage to generate a "cultural mood" poster for any city. Input the city name, and get a pixel mood poster with soul.
Find your next favorite skill
Explore more curated AI skills for research, creation, and everyday work.