Featured by
nene@YouMind.AI
Why we love this skill
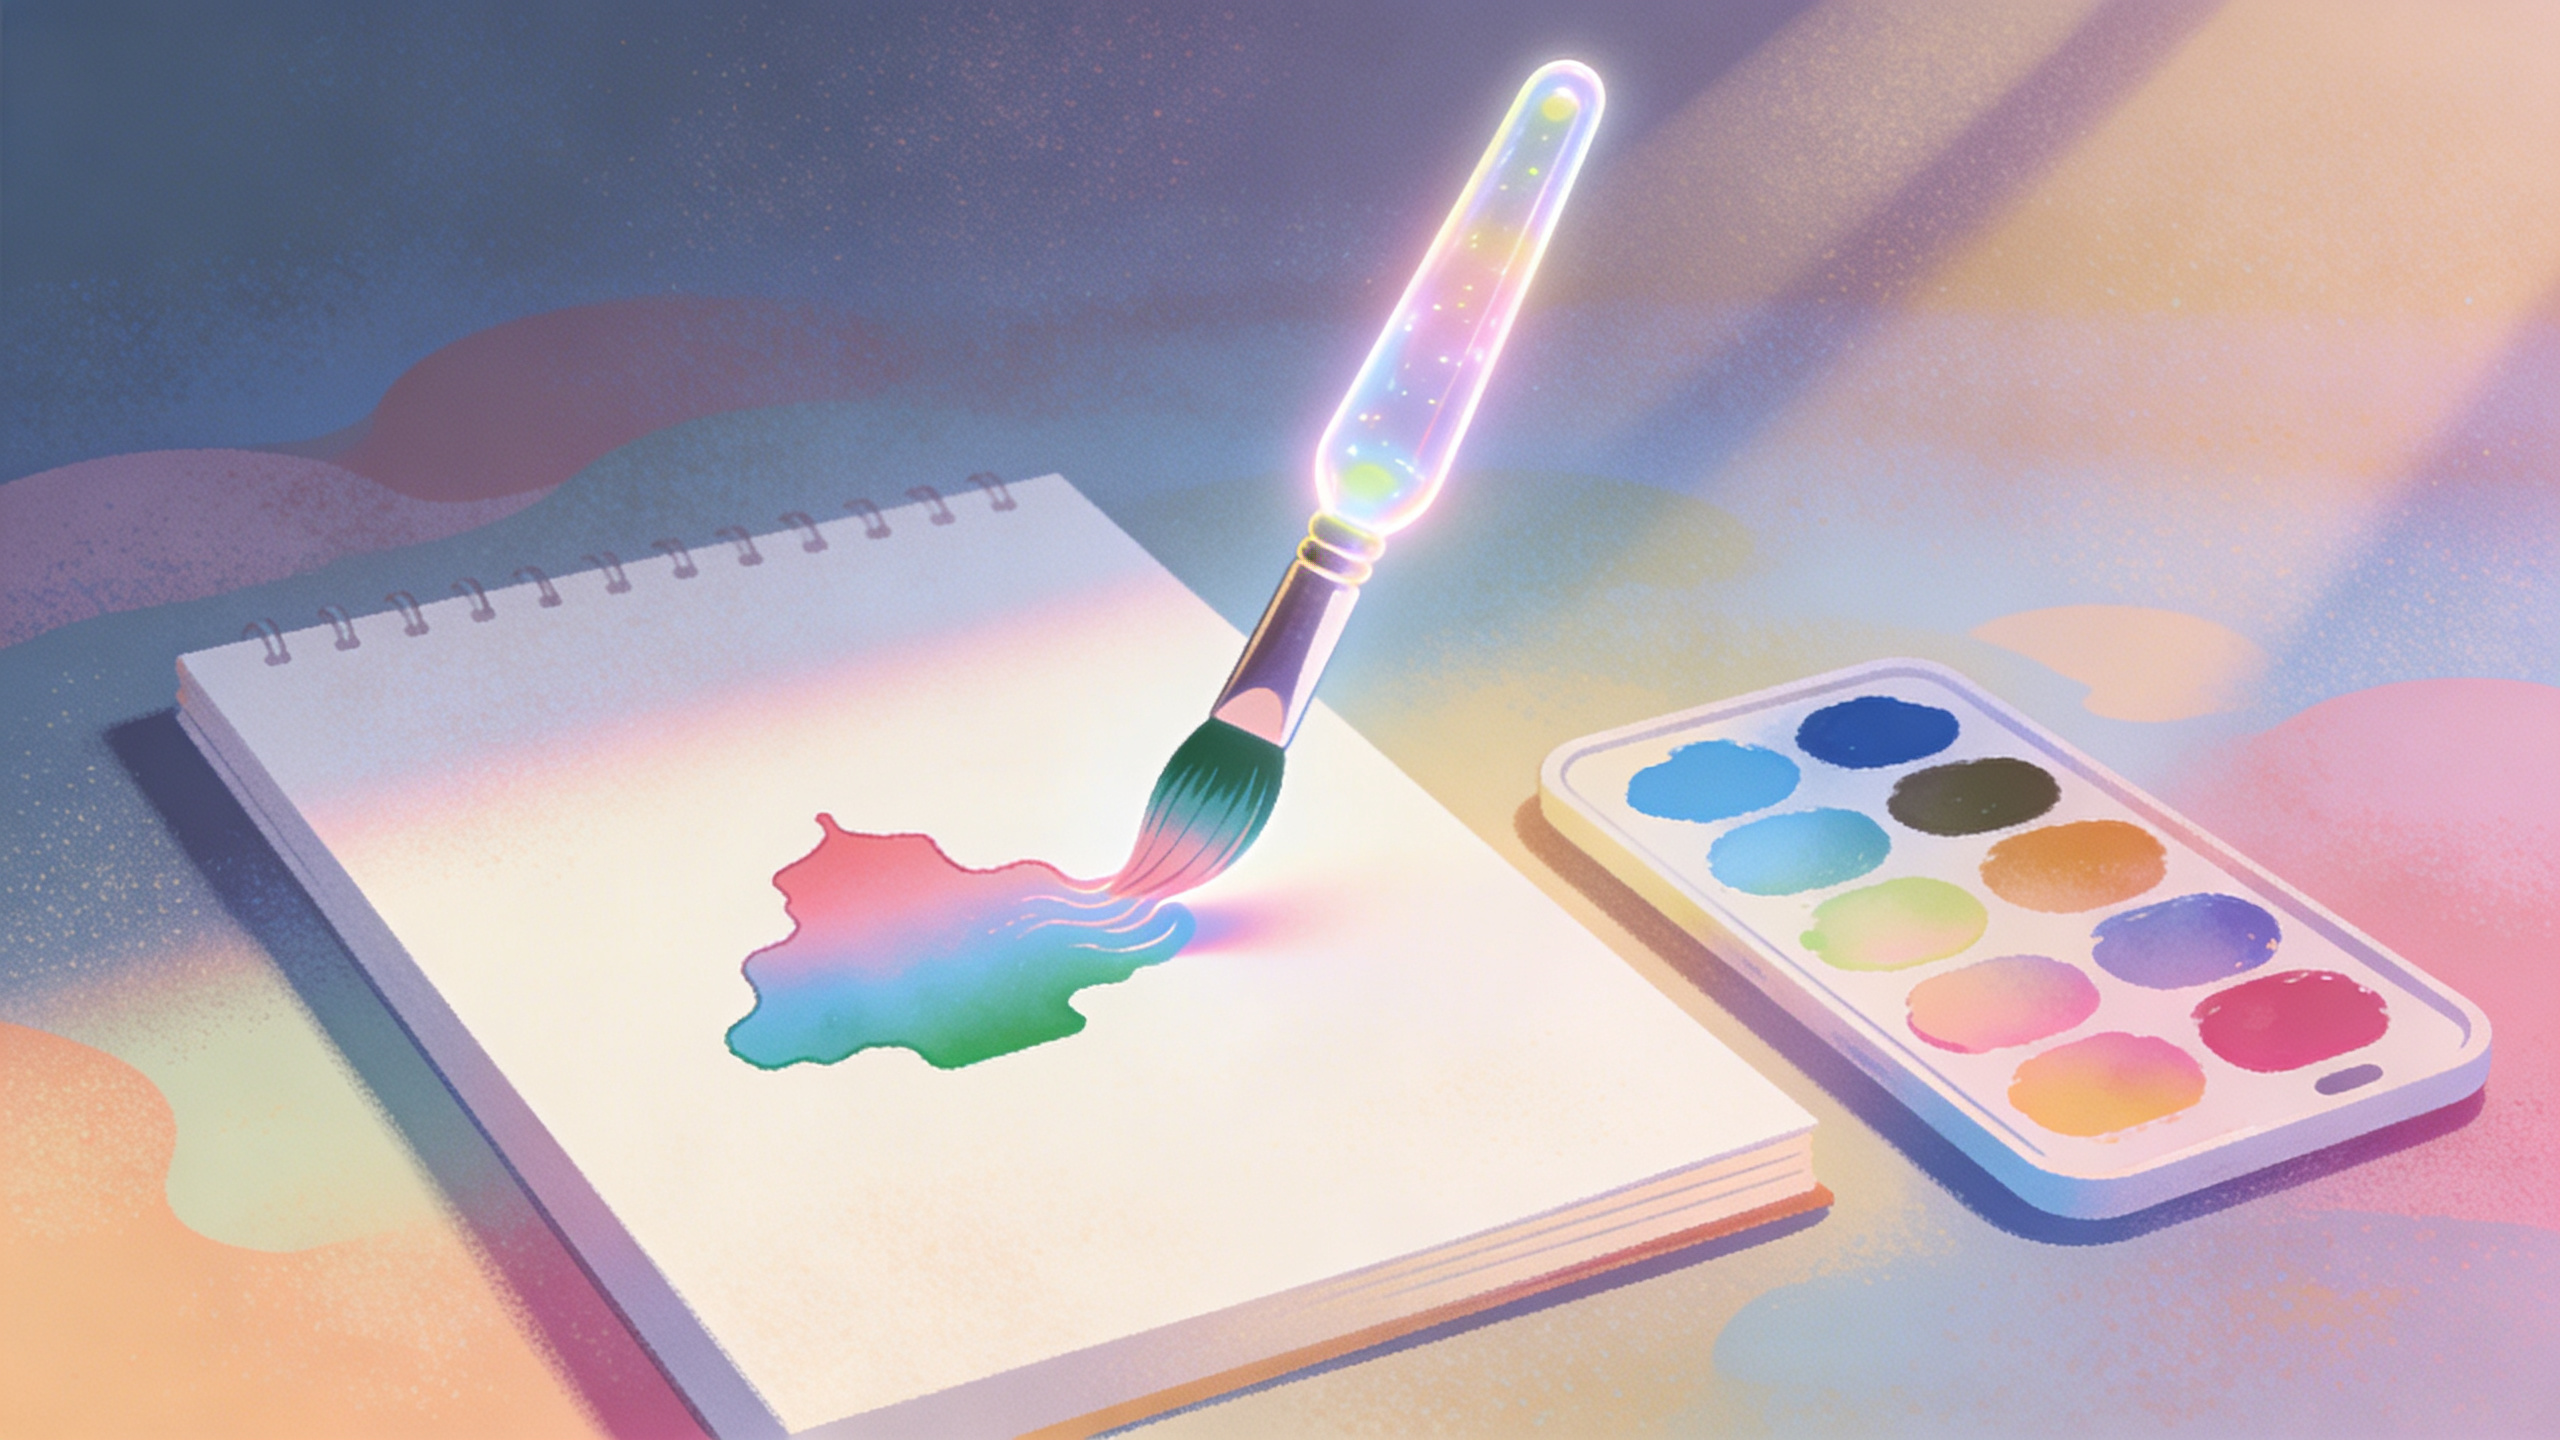
This skill is your personal "data storyteller," transforming complex scientific data into vivid, engaging, and easy-to-understand solutions using relatable analogies and minimalist charts. Whether it's global carbon emissions or myopia rates among teenagers, it uses language at a sixth-grade elementary school level and relatable metaphors to allow even users with no prior knowledge to easily understand the meaning behind the data within 3 minutes, truly achieving data visualization.
Instructions
The author has set the instructions to private. Below is a brief overview.
description
Transform complex data into vivid stories. Even sixth-grade students can easily understand the meaning behind the data, making science popularization fun and simple.
Related Skills
View all
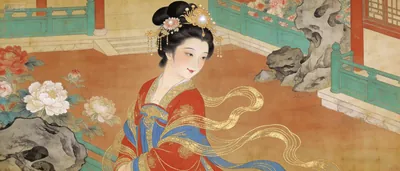
Poetry and painting share a common origin: AI visual translator for classical literature
This AI painting tool transforms classical Chinese poems and prose into traditional Chinese painting styles. It supports seven classic styles, including *Along the River During the Qingming Festival*, *A Thousand Miles of Rivers and Mountains*, *Dwelling in the Fuchun Mountains*, *Nymph of the Luo River*, and Tang Yin's *Ladies of the Court*. It offers four output formats: scroll, single panel, series, and storyboard. It supports both Chinese and English and is compatible with mainstream AI painting platforms such as Midjourney, Keling, and Jimeng. It can also directly generate images from Youmind, with good results in testing; Doubao (a Chinese painting platform) also supports this.
Creative Illustration Designer V4.0
Transform your moments of inspiration, travel memories, and city impressions into professional hand-drawn sketches. • Visualize Inspiration: Describe the images in your mind, and AI will search and provide specific visual element options. • Visualize Memories: Transform places you've been and special experiences into permanently storable hand-drawn artworks. • Three Creative Options: Choose from three directions: architectural aesthetics, cultural stories, and modern fashion. • Iterative Optimization: Supports 3 rounds of adjustments; color schemes, compositions, and styles can be changed at any time. • Commercial-Grade Output: Procreate hand-drawn quality, directly usable for postcards, canvas bags, social media, and brand design. Usage Scenarios: ✨ Record Travel: Draw the cities and special places you've visited. ✨ Capture Inspiration: Instantly visualize the images that flash in your mind. ✨ Cultural and Creative Design: Create professional commercial artwork even with zero art background. ✨ Emotional Expression: Turn an experience or a story into a visual work. Simply say, "I want to draw the West Lake in Hangzhou that I visited last week," or "I have an image in my mind that I want to draw," and answer 6 questions in the questionnaire to receive 4 high-quality hand-drawn artworks.
![[Education Innovation Competition] Science and Education Integration Full-Process System v1.0](https://cdn.gooo.ai/web-images/92906a1c9ea03526316d410c0b441dc24f36d39c9008b8ce9f3197aad85d20e2)
[Education Innovation Competition] Science and Education Integration Full-Process System v1.0
A top-tier advisory tool for teaching innovation competitions, designed specifically for university humanities and social sciences faculty. With a single click, it transforms massive amounts of teaching and research materials (personal research + cutting-edge academic literature) into competition-level lesson plans, automatically generating high-quality, hand-drawn mind maps of the subject's frontiers with zero garbled text. Suitable for: - University teachers interested in participating in teaching innovation competitions - University humanities and social sciences faculty who need to transform research results into teaching content - Frontline teachers who wish to enhance the academic depth and cutting-edge nature of their lesson plans. Highlights: ✨ v1.0 First stable version, meticulously crafted to ensure stability and reliability. Core advantages: ① Intelligent source tracking and packaging, clearly distinguishing between personal research and academic literature ② Deep transformation of research into teaching, providing OBE-oriented complete lesson plans ③ High-quality Chinese mind maps directly output, detailing the dynamic integration of knowledge points and cutting-edge research ④ Supports uploading 50 files, compatible with diverse formats such as video, audio, PDF, Word, Excel, PPT, and animation. Strictly aligns with the scoring standards of the National Teaching Innovation Competition, providing a step-by-step navigation workflow to make your entry materials stand out!
![[Education Innovation Competition] Science and Education Integration Full-Process System v1.0](https://cdn.gooo.ai/web-images/44ca66dc7504370ecf4f2043c15e0225d72b2a6c4f31989574e3cad61d3593eb@small)
Visualizing all content data
Featured by
nene@YouMind.AI
Why we love this skill
This skill is your personal "data storyteller," transforming complex scientific data into vivid, engaging, and easy-to-understand solutions using relatable analogies and minimalist charts. Whether it's global carbon emissions or myopia rates among teenagers, it uses language at a sixth-grade elementary school level and relatable metaphors to allow even users with no prior knowledge to easily understand the meaning behind the data within 3 minutes, truly achieving data visualization.
Instructions
The author has set the instructions to private. Below is a brief overview.
description
Transform complex data into vivid stories. Even sixth-grade students can easily understand the meaning behind the data, making science popularization fun and simple.
Related Skills
View allPoetry and painting share a common origin: AI visual translator for classical literature
This AI painting tool transforms classical Chinese poems and prose into traditional Chinese painting styles. It supports seven classic styles, including *Along the River During the Qingming Festival*, *A Thousand Miles of Rivers and Mountains*, *Dwelling in the Fuchun Mountains*, *Nymph of the Luo River*, and Tang Yin's *Ladies of the Court*. It offers four output formats: scroll, single panel, series, and storyboard. It supports both Chinese and English and is compatible with mainstream AI painting platforms such as Midjourney, Keling, and Jimeng. It can also directly generate images from Youmind, with good results in testing; Doubao (a Chinese painting platform) also supports this.
Creative Illustration Designer V4.0
Transform your moments of inspiration, travel memories, and city impressions into professional hand-drawn sketches. • Visualize Inspiration: Describe the images in your mind, and AI will search and provide specific visual element options. • Visualize Memories: Transform places you've been and special experiences into permanently storable hand-drawn artworks. • Three Creative Options: Choose from three directions: architectural aesthetics, cultural stories, and modern fashion. • Iterative Optimization: Supports 3 rounds of adjustments; color schemes, compositions, and styles can be changed at any time. • Commercial-Grade Output: Procreate hand-drawn quality, directly usable for postcards, canvas bags, social media, and brand design. Usage Scenarios: ✨ Record Travel: Draw the cities and special places you've visited. ✨ Capture Inspiration: Instantly visualize the images that flash in your mind. ✨ Cultural and Creative Design: Create professional commercial artwork even with zero art background. ✨ Emotional Expression: Turn an experience or a story into a visual work. Simply say, "I want to draw the West Lake in Hangzhou that I visited last week," or "I have an image in my mind that I want to draw," and answer 6 questions in the questionnaire to receive 4 high-quality hand-drawn artworks.
[Education Innovation Competition] Science and Education Integration Full-Process System v1.0
A top-tier advisory tool for teaching innovation competitions, designed specifically for university humanities and social sciences faculty. With a single click, it transforms massive amounts of teaching and research materials (personal research + cutting-edge academic literature) into competition-level lesson plans, automatically generating high-quality, hand-drawn mind maps of the subject's frontiers with zero garbled text. Suitable for: - University teachers interested in participating in teaching innovation competitions - University humanities and social sciences faculty who need to transform research results into teaching content - Frontline teachers who wish to enhance the academic depth and cutting-edge nature of their lesson plans. Highlights: ✨ v1.0 First stable version, meticulously crafted to ensure stability and reliability. Core advantages: ① Intelligent source tracking and packaging, clearly distinguishing between personal research and academic literature ② Deep transformation of research into teaching, providing OBE-oriented complete lesson plans ③ High-quality Chinese mind maps directly output, detailing the dynamic integration of knowledge points and cutting-edge research ④ Supports uploading 50 files, compatible with diverse formats such as video, audio, PDF, Word, Excel, PPT, and animation. Strictly aligns with the scoring standards of the National Teaching Innovation Competition, providing a step-by-step navigation workflow to make your entry materials stand out!
Find your next favorite skill
Explore more curated AI skills for research, creation, and everyday work.