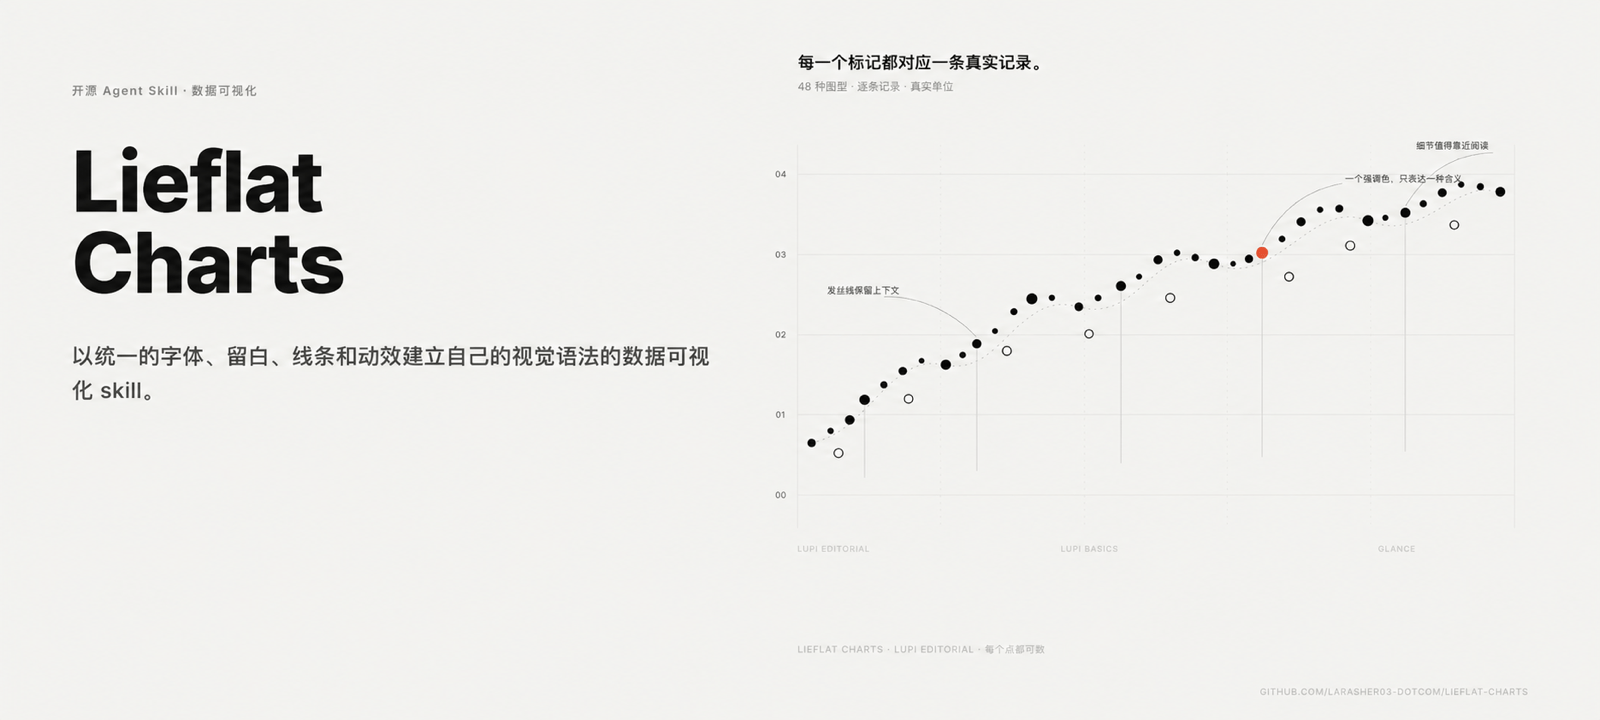
Lieflat Top-Tier Charts
Stunning charts with smooth animations and 60+ graph types
Showcase
Description
This is a data visualization, presentation, and full-page report generation skill following the Agent Skills format. It supports PPT mode and report mode while defaulting to charts. It enters PPT mode to generate HTML or PDF slides only when the user explicitly requests a presentation, slide deck, or flip report, and generates full-page HTML reports only when the user explicitly requests a report, annual review, monthly report, white paper, poster, or brief. It establishes its own visual grammar using unified typography, whitespace, lines, and animations across several visual styles: Lupi (Editorial Narrative): Uses thin lines, dot matrices, bullet points, and ample whitespace to unfold data with an emphasis on real units, details, and side notes. It is ideal for papers, long articles, annual reports, and data stories meant for close reading. Glance (Quick Insight): Uses thick bars, large numbers, color blocks, and clear rankings to aggregate information in advance so readers can spot highs, trends, and anomalies within seconds. It is ideal for weekly reports, briefings, and dashboards. Basics (Essential Editorial): Retains familiar outlines like bar charts, line graphs, and donut charts, adding texture through countable scales, hairline strokes, and editorial layouts. It is ideal for content with simple structures or smaller data sets. In addition, standalone interactive large-scale graphics such as networks, paths, and multi-segment flows are provided. Each chart strives to preserve true data units while incorporating titles, side notes, sources, and page structures into the narrative. The skill offers 4 different color palettes including Mono, Celadon Blue, Coconut Green, and Editorial Red, covering chart styles for a wide variety of scenarios.
Recommended by
Dancang
Why we love this skill
Featuring over 60 high-aesthetics chart types that accurately translate natural language into semantically honest, publication-ready visuals. A unique template-first approach, animation, and color systems bring editorial polish and data credibility to charts, Slides, and full-page reports.
Best for
Writers, marketers, and presenters who need to turn data into readable charts, presentations, or full-page reports.
How to use this Skill
Provide your input
Provide data and specify whether you want to create a chart, a full-page report, or a slide deck, along with any details on audience, purpose, time range, and sources.
Run the Skill
Selects the appropriate visual expression based on data content and format, organizing titles, notes, legends, and sources, and generates the final output for presentations or reports when requested.
Review your result
Receive ready-to-view charts, or HTML/PDF slide decks and full-page HTML reports when presentations or reports are explicitly requested.
Related Skills
View all Slides
White Space | Minimalist PPT
"White Space" is a Skill specifically designed to generate minimalist research report slides. Upload Word, PDF, web pages, data tables, research materials, or old PPTs, and it will convert them into an editable PPT with a cool white background, black-gray text, generous white space, thin line separators, and a touch of deep red accents. It automatically completes: · Reading and organizing raw materials · Extracting core conclusions from the report · Building a complete presentation storyline · Generating conclusion-style titles with one point per page · Redrawing native editable data charts · Unifying fonts, colors, margins, and page grids · Controlling text and chart density per page · Adding page numbers, dates, and data sources · Outputting actually editable Slides By default, it uses a 16:9 aspect ratio, with visual features including: · Cool white background · Black-gray text · Single deep red accent color · All left-aligned · Generous white space · Minimalist architectural geometry · At most two fonts throughout · Charts and shapes are fully editable Suitable for industry research, market analysis, business presentations, strategic plans, course reports, graduation defenses, and management reports. Simply upload your materials and describe the presentation scenario to generate a clean, professional, directly editable and presentable minimalist PPT.
 Slides
Consulting-Style Slides
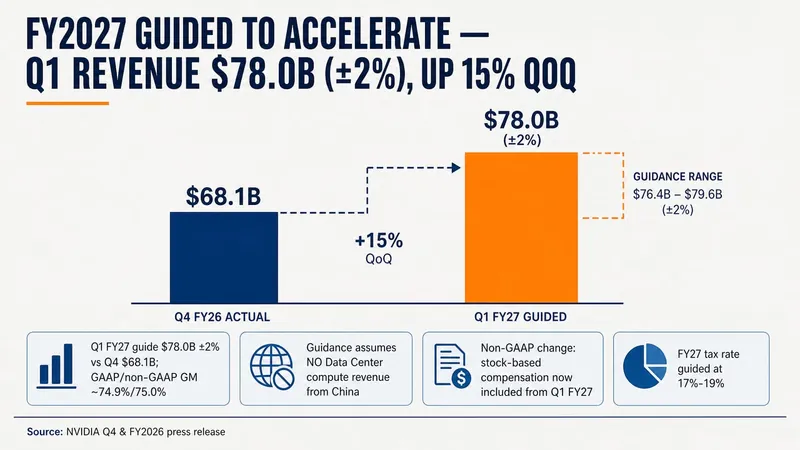
This Skill helps you create high-quality business Slides to the professional standards of top-tier consulting firms. It strictly follows the Pyramid Principle and applies the core ideas of leading with conclusions, progressing logically, and using data to turn scattered business insights into structured, coherent presentations. Whether you are developing a strategy, proposing a project, or conducting a business analysis, it helps you quickly build a framework based on the MECE principle, ensuring that points are mutually exclusive and collectively exhaustive. During content development, this Skill automatically distills insightful slide titles and recommends the most suitable visualizations based on your data, such as waterfall charts, funnel charts, and stacked bar charts. It provides structured design guidance and can also generate a professional Slides file with title slides, content slides, comparison slides, and chart placeholders. The generated document uses a classic dark blue and orange business color palette, with clean, professional layouts and clear visual hierarchy, helping your presentation demonstrate a high level of professionalism in both design and content.
Professional Infographic Maker
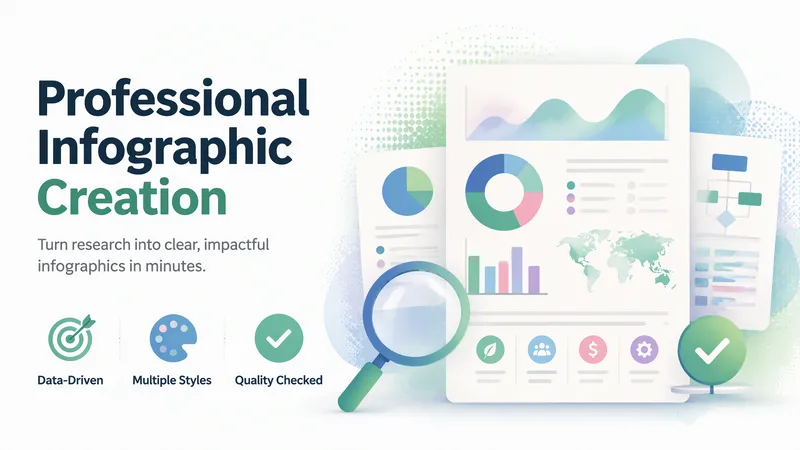
Quickly transform complex information, data, and ideas into clear, professional, publication-ready infographics. Simply describe your topic, content, and purpose to generate visual outputs suitable for reports, marketing materials, presentations, internal documents, and social media without requiring any design experience. It supports common formats such as data visualizations, timelines, flowcharts, comparison charts, list summaries, geographic distributions, hierarchical structures, resumes, and social media graphics. It also matches visual styles to scenarios like enterprise, healthcare, technology, education, finance, and environmental protection. You can choose color schemes tailored to different audiences, including accessible palettes that are easier to read and considerate of color vision deficiencies. For content like market trends, industry statistics, scientific and medical information, or recent events, it can combine real-time research to supplement facts, figures, and background, helping reduce outdated or unsupported information. The generated results undergo quality checks focusing on layout hierarchy, text readability, data expression, color contrast, and overall communication effectiveness, with necessary optimizations for the use case. It is ideal for creating business report charts, product comparisons, project milestones, how-to guides, and social media content.
Information
- Version
- v2
- Last updated
- Runtime credits
- Usage-based
- Models
- Auto
- Use cases
- Images & designPresentations & reporting
- What you get
- ReportSlidesDiagram
- Visual styles
- MinimalistEditorial