DataCanvas
DataCanvas
Showcase
Description
Data speaks for itself; it just needs a stage. DataCanvas automatically transforms your CSV/Excel/JSON data into professional-grade visual analysis reports. Inspired by the anti-AI aesthetic philosophy of the 11k-star project huashu-design (banning purple gradients, emoji decorations, and bento grids), all charts are hand-coded in pure SVG without relying on any external JS libraries. It includes 6 report templates (Daily/Weekly Operations, Competitor Comparison, User Profiles, Investment Analysis, Free Report) x 5 design styles (Information Architecture, Oriental Minimalism, Swiss Grid, Dark Data, Business Classic), supporting over 20 chart types. From data upload to polished report, everything is automated: data cleaning, statistical analysis, trend insights, chart generation — all in one go.
Related Skills
View all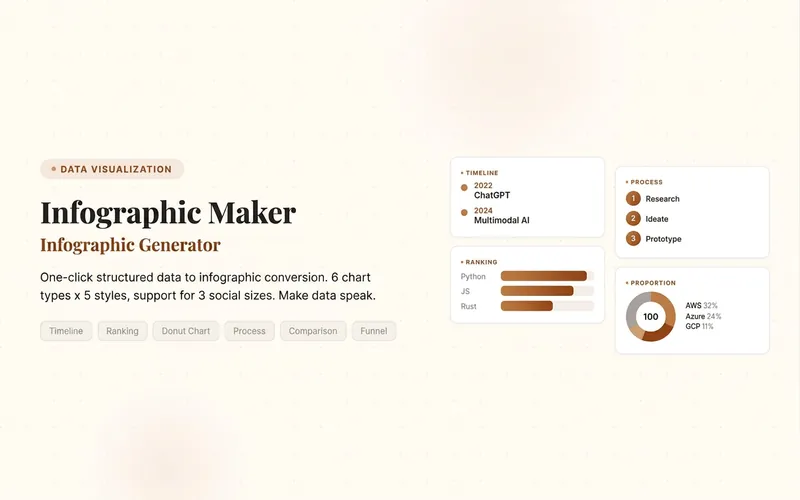 Image
Infographic Maker
Easily turn any article, table, link, or casual note into a professional infographic, making your data and insights stand out. Whether it's a single poster or a multi-page carousel, this tool intelligently identifies content structure and automatically extracts key information—no manual formatting required. Choose from six chart types: timeline, flowchart, ranking, proportion, comparison, or funnel, and pair them with visual styles like Business Blue, Creative Color, Dark Tech, Elegant Warm, Minimalist Black & White, or Xiaohongshu-exclusive styles. We specially support Chinese content and brand colors to ensure visuals are both professional and aligned with your brand identity. Whether for annual reports, social media (e.g., Xiaohongshu, Instagram, X), or study notes, this tool generates high-resolution PNG images in multiple sizes, helping your information spread in the most appealing way. Say goodbye to tedious design work—create stunning infographics with one click, letting data speak and stories come alive. Companion tools: For final drafts to be published on WeChat Official Accounts, look for '公众号排版器'; for data tables needing publication-grade formatting, look for 'TableCraft'; for quote card sets, look for '知识卡片生成工坊'.

Data Analysis Pipeline
📊 From raw Excel to reports with charts, all in one pipeline—no more jumping between multiple tools. 🔁 Four-stage analytical relay (AI automatically switches analysis style—no need to manually change models): 🧹 Data cleaning: automatically handles nulls, outliers, formatting, and duplicates, outputting clean tables 🔬 Deep analysis: descriptive statistics, correlation, attribution, trends, hypothesis testing, with supporting data evidence 📈 Visualization: automatically selects optimal chart types—2–4 core charts explained in one sentence 📝 Report writing: conclusion-first, well-structured analysis reports in Chinese, with actionable recommendations 👥 Use cases: business data analysis, operational reviews, financial reports, user behavior research, academic data exploration—any scenario where you need to turn tables into insights. 💡 Default output is Markdown reports, convertible to Word/PPT. Report style automatically adjusts based on the reader's role (manager/colleague/yourself).

Ecommerce Operations Dashboard
📊 **One-sentence value**: Upload store data, and AI automatically generates an e-commerce operations dashboard with core metrics, trend charts, and operational insights. 🔍 **Core features**: - **One-click dashboard generation**: Upload data exported from any e-commerce backend, and it automatically cleans, calculates, and visualizes. - **Five key metric categories**: Traffic, conversion, sales, users, and products—covering all dimensions of operations. - **Multiple dashboard types**: Supports daily reports, live-stream dashboards, product dashboards, and user dashboards, switchable on demand. - **Smart insights engine**: Automatically identifies trend turning points and abnormal fluctuations, and generates actionable operational recommendations. - **Ready to use**: Outputs a standalone HTML dashboard that opens in your browser with a double-click—no configuration required. 🎯 **Use cases**: - 📊 **Daily/weekly report automation**: Generate a daily operations report in 1 minute every day—no more manual spreadsheets. - 📈 **Sales event review**: After 618 or Double 11, generate a full-dimensional review dashboard with one click. - 🛍️ **Multi-platform management**: Unified dashboards for data from Taobao, JD.com, Douyin, and Pinduoduo. - 🎯 **Operations decisions**: Use data to drive product selection, pricing, and campaign strategy adjustments. - 📱 **Live-stream review**: Generate GPM, engagement rate, and conversion funnel from live session data with one click. 👩💼 **Who it's for**: E-commerce operators, store managers, data analysts, live-stream operators, and e-commerce entrepreneurs—anyone who needs to quickly understand their store's performance.
Information
- Version
- v2
- Last updated
- Runtime credits
- Usage-based
- Models
- Auto