NotebookLM style image generator
Based on the information I provided, create an information chart similar to the NotebookLM style.
Why we love this skill
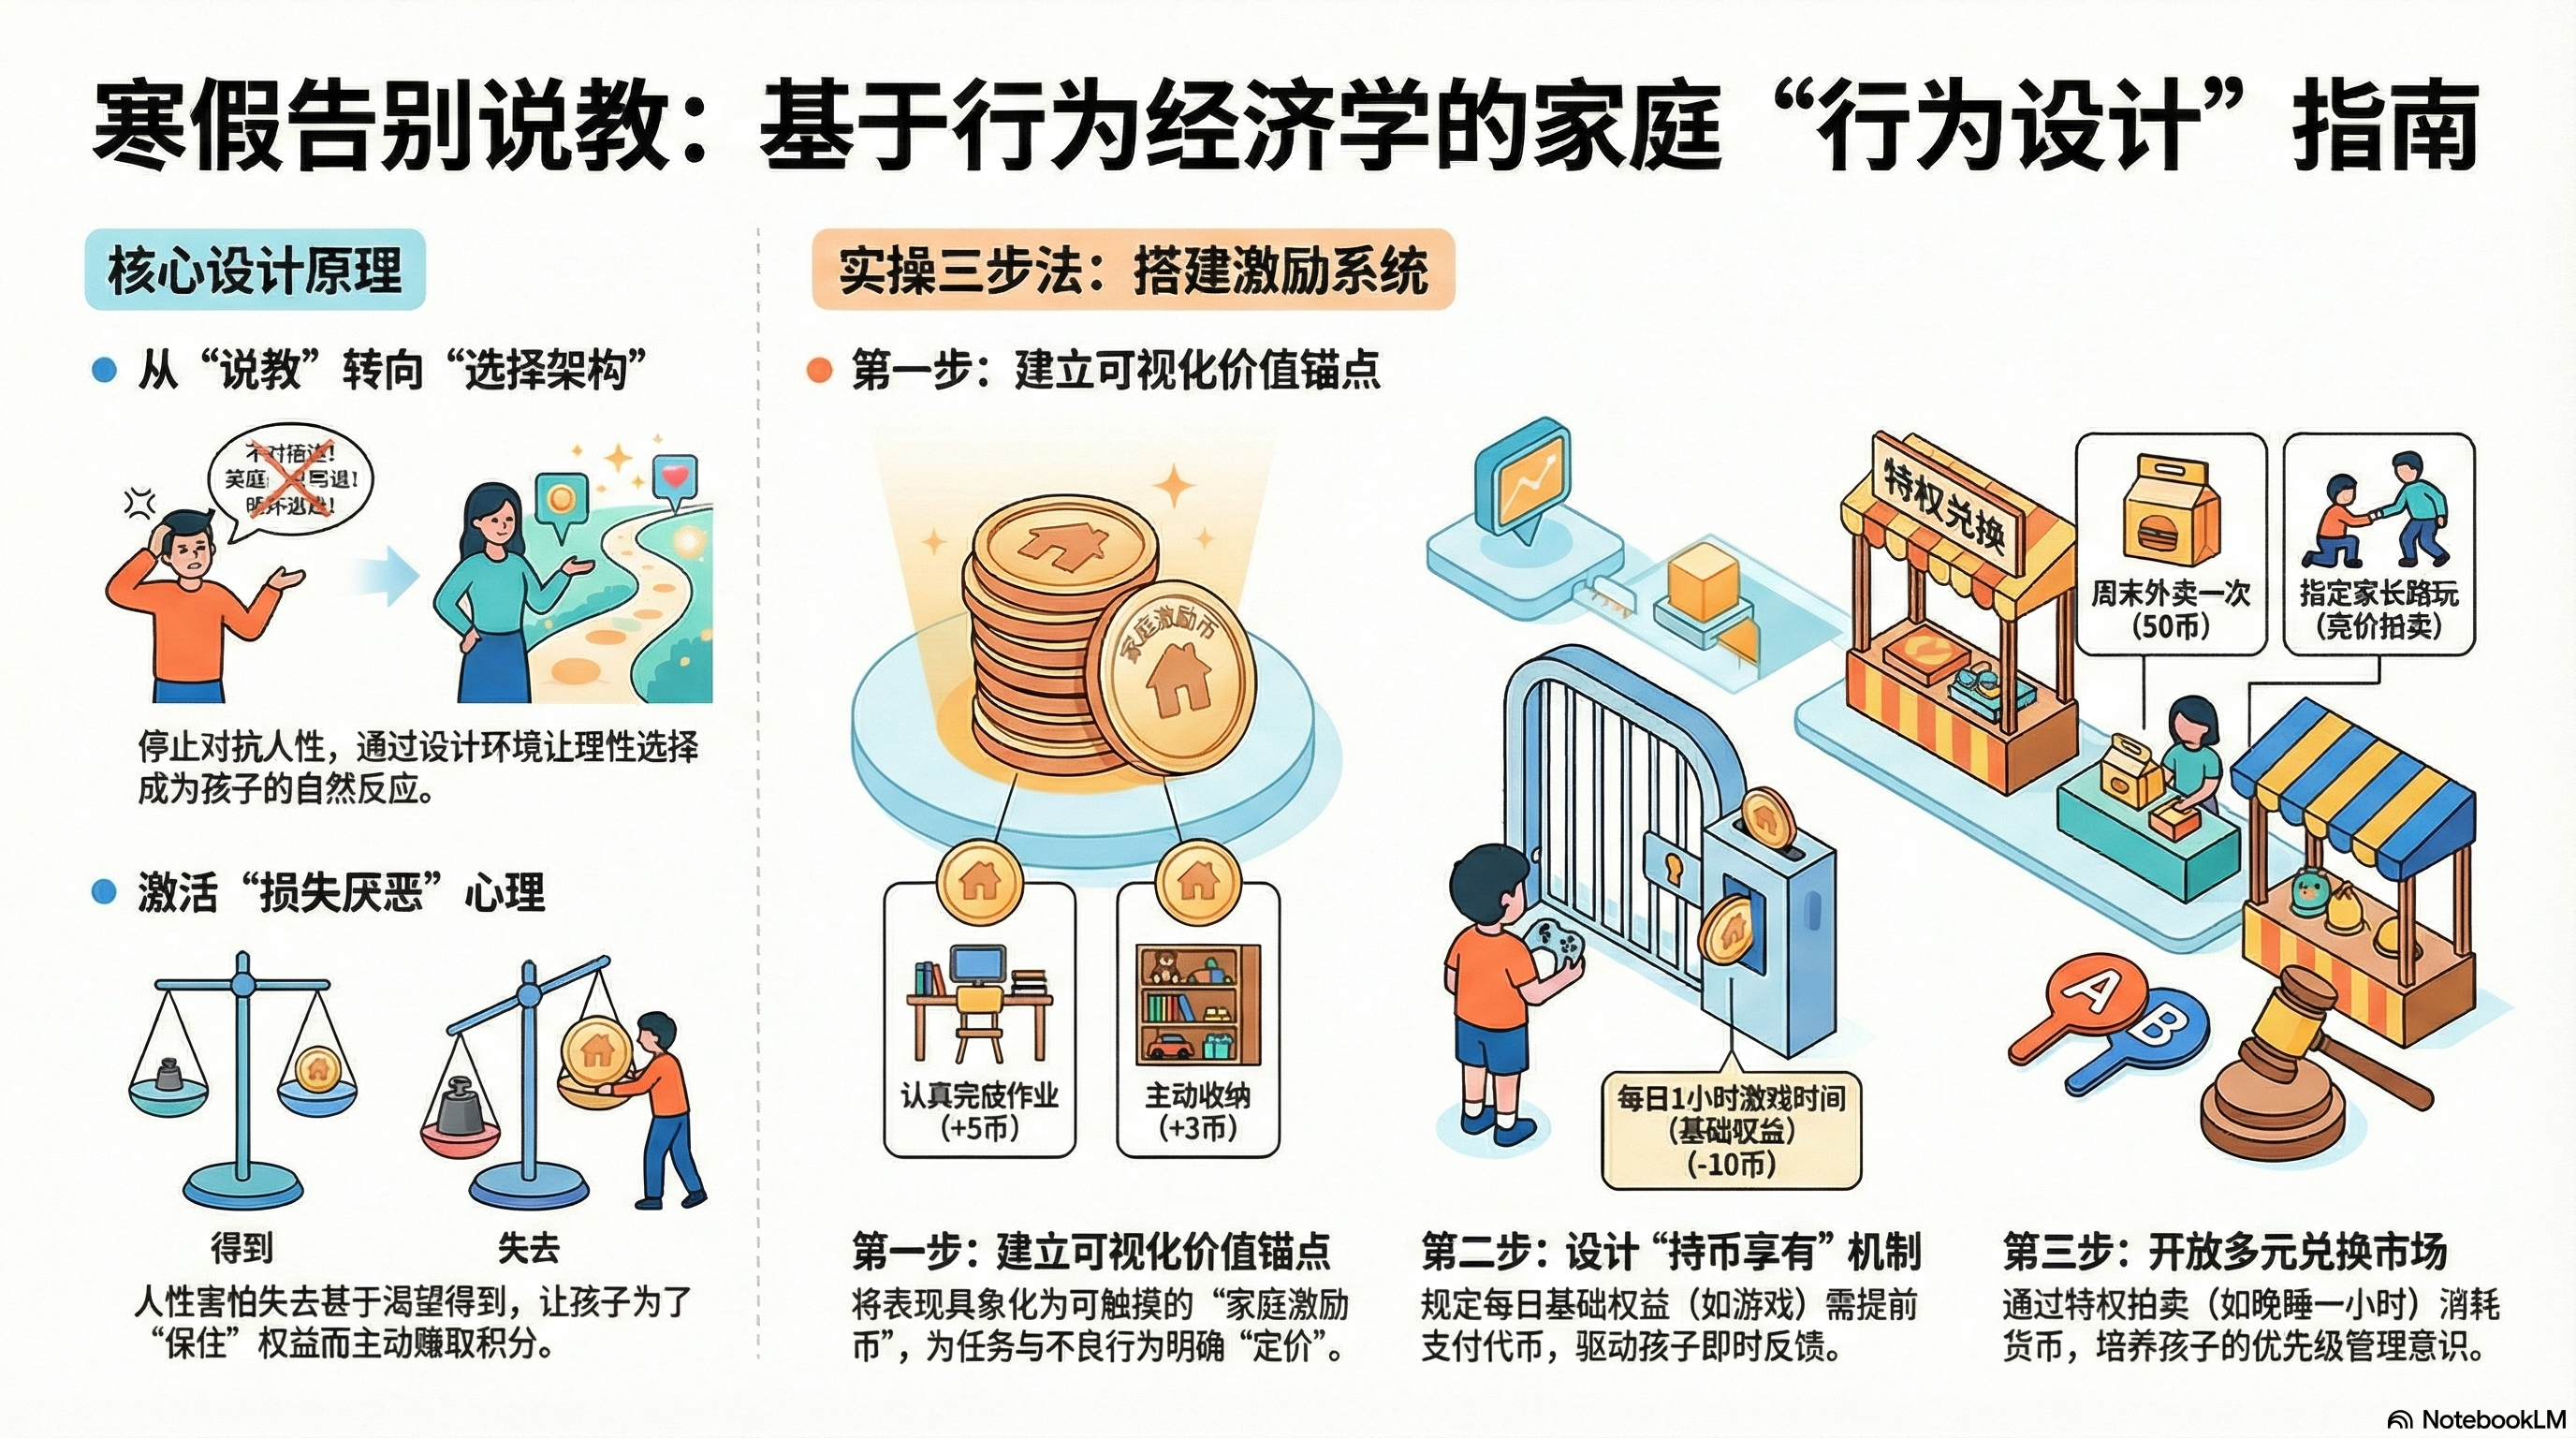
This skill transforms complex knowledge into NotebookLM-style hand-drawn infographics, presenting pain points, theoretical support, and three-step solutions with a unique visual style. Through vivid cartoon characters, hand-drawn textures, and a clear layout, it helps users intuitively understand and solve problems, making it an ideal tool for efficient information delivery and learning.
Author
betteryunyun
Categories
Instructions
The author has set the instructions to private. Below is a brief overview.
This skill aims to transform complex knowledge into clear, visually appealing, and easy-to-understand hand-drawn infographics. Designed specifically for educators, content creators, and professionals who need to effectively communicate complex concepts, it helps them visualize abstract theories and practical steps. Using this skill, users can obtain a well-structured infographic with engaging visual elements. The infographic first visually presents the user's pain points through vivid scene illustrations and emotional expressions, supplemented by book citations, mechanism diagrams, or comparative analyses to provide theoretical support. Next, it offers a three-step practical solution presented as circular icons and detailed cards, guiding the user through the process with a flow path and footprints. Finally, the infographic summarizes the core idea with a concise summary and provides a clear call-to-action button. The entire design uses a light beige background, a soft color scheme, hand-drawn cartoon characters, and rounded fonts to ensure rich information while maintaining visual comfort and high readability. Whether for teaching, sharing, or personal learning, users can make knowledge delivery more attractive and in-depth through this unique visualization method.
Related Skills
View allYouMind Style Background Image
Generate a YouMind brand style abstract image for background use. Font Guidelines: Use <Libre Baskerville> for English titles and <Source Sans> for Chinese titles.

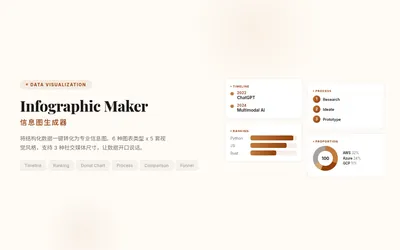
Infographic Maker
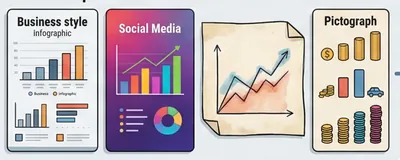
Say goodbye to the hassle of manually creating charts. Simply provide your structured data, and Infographic Maker can generate high-quality PNG infographics with a single click. It features 6 built-in chart types (timeline, flowchart, leaderboard, scale chart, comparison chart, funnel chart) and 5 meticulously crafted visual styles (Business Blue, Creative Color, Dark Tech, Elegant Warm, Minimalist Black and White), easily covering all scenarios from annual reports to social media. Supporting Instagram Stories (9:16), Feed (4:5), and Square (1:1) sizes, it lets your data speak for itself.
Data Visualization
Generate visualizations based on user-provided data that conform to the Storytelling with Data (SWD) principle. Triggering conditions: This skill must be used when a user provides data and requests "draw a chart," "generate a chart," "visualize," "make a graph," or "show me this data," or uploads CSV/Excel/spreadsheet data and wants to see a graphical representation. Even if the user only says "analyze this data" and the data is suitable for visualization, this skill should still be used to generate a chart.
NotebookLM style image generator
Based on the information I provided, create an information chart similar to the NotebookLM style.
Why we love this skill
This skill transforms complex knowledge into NotebookLM-style hand-drawn infographics, presenting pain points, theoretical support, and three-step solutions with a unique visual style. Through vivid cartoon characters, hand-drawn textures, and a clear layout, it helps users intuitively understand and solve problems, making it an ideal tool for efficient information delivery and learning.
Author
betteryunyun
Categories
images
Instructions
The author has set the instructions to private. Below is a brief overview.
This skill aims to transform complex knowledge into clear, visually appealing, and easy-to-understand hand-drawn infographics. Designed specifically for educators, content creators, and professionals who need to effectively communicate complex concepts, it helps them visualize abstract theories and practical steps. Using this skill, users can obtain a well-structured infographic with engaging visual elements. The infographic first visually presents the user's pain points through vivid scene illustrations and emotional expressions, supplemented by book citations, mechanism diagrams, or comparative analyses to provide theoretical support. Next, it offers a three-step practical solution presented as circular icons and detailed cards, guiding the user through the process with a flow path and footprints. Finally, the infographic summarizes the core idea with a concise summary and provides a clear call-to-action button. The entire design uses a light beige background, a soft color scheme, hand-drawn cartoon characters, and rounded fonts to ensure rich information while maintaining visual comfort and high readability. Whether for teaching, sharing, or personal learning, users can make knowledge delivery more attractive and in-depth through this unique visualization method.
Related Skills
View allYouMind Style Background Image
Generate a YouMind brand style abstract image for background use. Font Guidelines: Use <Libre Baskerville> for English titles and <Source Sans> for Chinese titles.
Infographic Maker
Say goodbye to the hassle of manually creating charts. Simply provide your structured data, and Infographic Maker can generate high-quality PNG infographics with a single click. It features 6 built-in chart types (timeline, flowchart, leaderboard, scale chart, comparison chart, funnel chart) and 5 meticulously crafted visual styles (Business Blue, Creative Color, Dark Tech, Elegant Warm, Minimalist Black and White), easily covering all scenarios from annual reports to social media. Supporting Instagram Stories (9:16), Feed (4:5), and Square (1:1) sizes, it lets your data speak for itself.
Data Visualization
Generate visualizations based on user-provided data that conform to the Storytelling with Data (SWD) principle. Triggering conditions: This skill must be used when a user provides data and requests "draw a chart," "generate a chart," "visualize," "make a graph," or "show me this data," or uploads CSV/Excel/spreadsheet data and wants to see a graphical representation. Even if the user only says "analyze this data" and the data is suitable for visualization, this skill should still be used to generate a chart.
Find your next favorite skill
Explore more curated AI skills for research, creation, and everyday work.