Geography Illustrated
Visual cards for geography and science
Geography Illustrated
Visual cards for geography and science
Showcase
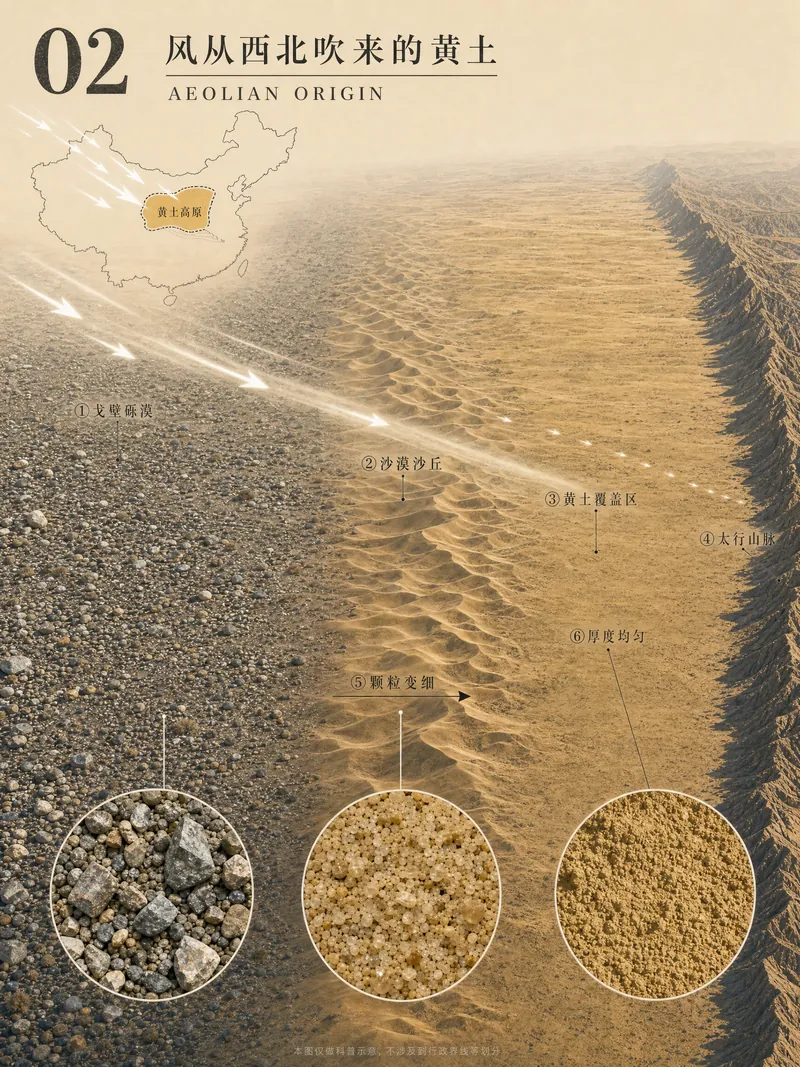
黄土高原图解绘制
黄土高原图解02-风从西北吹来的黄土(修改版3)
黄土高原图解绘制
黄土高原图解02-风从西北吹来的黄土(修改版3)
Description
Enter a geography concept name to generate a set of 8 vertical 3:4 illustrated cards that break down complex geography knowledge into a coherent visual narrative, suitable for high school geography teaching and science communication.
Related Skills
View all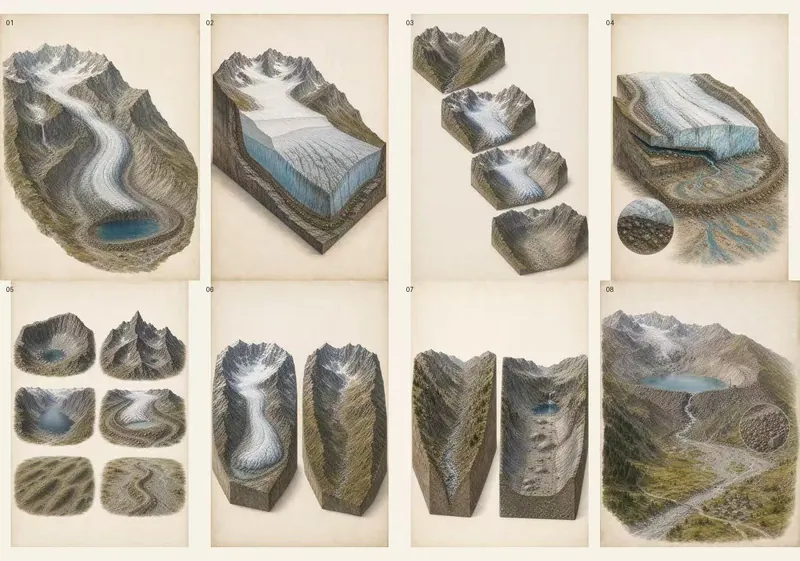
图解地理景观(适合PPT版)
Create complete 8-card “万物图解” geography series: warm-paper low-saturation 3:4 portrait explainers with coherent landscape models, cutaways, process stages, selective material or energy flows, precise visible-target labels, micro-detail insets, comparisons, and deterministic Chinese typography. Use when the user gives any landform, geology, climate, atmosphere, hydrology, ocean, ecosystem, settlement, resource, hazard, or other geography concept and asks for 万物图解、八张图解、地理概念拆解图、立体剖切图、景观分解图、机制示意图、公众号/小红书科普图,or asks to match the visual language of “万物图解局”.
 Image
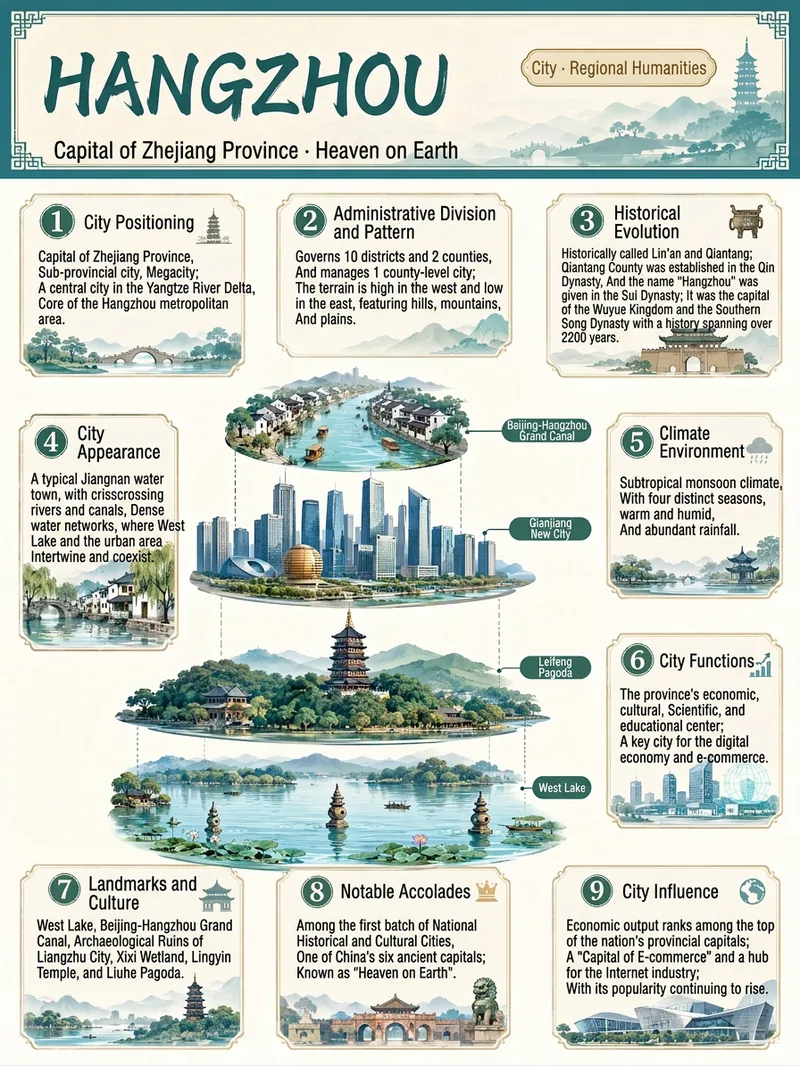
Everything Infographic Maker
Enter an object name to generate a vertical Chinese nine-panel object breakdown infographic for topics including organisms, machinery, plants, celestial bodies, vehicles, buildings, food, and more. Even with only an object name, the skill identifies suitable category labels, visual expression, and information priorities based on the object's features, using a vertical layout and Chinese by default. The design includes a title label at the top, a centered exploded, layered, or cutaway-style subject, and nine information modules arranged around it. These help readers quickly understand the object through its classification, structure, principles, environment, functions, related things, unique features, and relationship to humans. Different categories are matched with corresponding stable themes to maintain a consistent, readable educational layout. Before generation, key facts such as scientific names, numbers, and parameters are checked. The content is condensed into clear Chinese copy, then paired with an illustration or engineering diagram style suited to the object type to create an infographic with legible text and an orderly layout. You can also specify the audience, purpose, visual style, language, or aspect ratio to better fit presentation, teaching, and educational communication scenarios.
 Image
Viral Info Atlas Maker
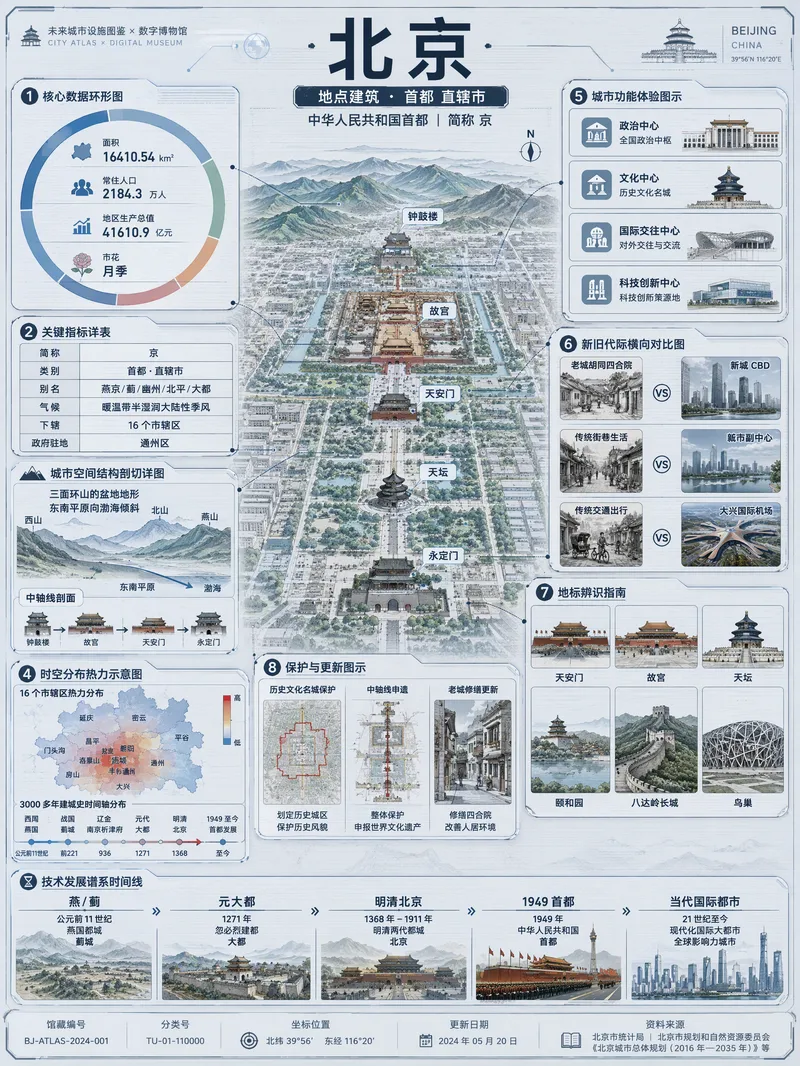
Quickly turn any subject name into a technology-inspired natural history atlas poster that combines rich information with strong visual appeal. Whether it’s a living thing, mineral or material, man-made object, place or building, cultural concept, or historical figure, the Skill organizes content for display and sharing based on your audience, focus, and language requirements. The Skill first uses real-time web research to verify definitions, key data, structure and composition, distribution, applications, evolution, identifying features, and more. It then arranges the content into a 3:4 vertical infographic. The poster centers on a specimen-style subject, surrounded by nine adaptive information modules covering core metrics, structural analysis, spatial and temporal distribution, context and use cases, comparisons, identification points, conservation or maintenance tips, and a development timeline. Module themes and information priorities are adjusted to fit the type of subject. The finished piece uses light gray-blue technical cardstock, precise linework, low-saturation cyan and blue washes, and a semi-transparent scanned texture. The result combines the visual style of a future-city infrastructure atlas with a digital museum display panel, while retaining the subject label at the top and a collection records area at the bottom. For obscure subjects or when information is limited, speculative content is distinguished with visual prompts. It is suitable for science education, exhibition introductions, knowledge sharing, and social media publishing.
Information
- Version
- v8
- Last updated
- Runtime credits
- Usage-based
- Models
- Auto