
Global ETF Radar
Screen opportunities, compare risk, and plan ETF trades
Global ETF Radar
Screen opportunities, compare risk, and plan ETF trades
Showcase
Description
An investment research and decision-support tool for global ETFs. It scans the market for short-term and swing opportunities, ranking them with transparent scores covering trends, relative strength, patterns, liquidity, risk-reward, and product structures. It generates conditional trading plans complete with entry ranges, trigger confirmations, invalidation points, stop-loss methods, targets, risk-reward ratios, and position-sizing formulas. Designed with conservative risk management that prioritizes drawdown control, it prefers staying on the sidelines over forcing trades. Triggered by phrases like "ETF scan," "ETF opportunities," "analyze this ETF," "semiconductor/gold/energy ETF," "swing trading plan," "portfolio risk check," "ETF backtest," or "compare ETFs." Core rules: never fabricate prices, timestamps, indicators, or fund flows; clearly distinguish real-time, delayed, closing, and historical data; and explicitly recommend waiting if no high-quality opportunities exist. For research and reference only; not investment advice.
Recommended by
Dancang
Why we love this skill
Built on a foundation of data freshness and reliability, it systematically breaks down ETF trends, liquidity, structure, and risks, translating analysis into actionable trading plans complete with triggers, invalidation levels, and position-sizing formulas. It recommends staying on the sidelines when evidence is insufficient, refusing to fabricate data or force recommendations.
Best for
Ideal for investors researching global ETFs, comparing risks, or building drawdown-focused conditional trading plans.
How to use this Skill
Provide your input
Provide the ETF ticker, theme, holdings, or backtest rules, along with your target market, timeframe, and risk preference.
Run the Skill
Using available and timestamped data, compares ETF trends, relative strength, liquidity, product structure, and risk to filter or analyze targets.
Review your result
Receive transparent opportunity rankings, ETF comparisons, risk checks, or conditional trading plans featuring triggers, invalidation levels, risk-reward ratios, and position sizing.
Related Skills
View all
Weekly Investment Coach
When you enter "Next week's investment advice," the skill automatically enters your configured "Weekly Investment Coach" mode. Within your specified range of A-shares, Hong Kong Stock Connect, and domestic ETFs, it follows the principles of "framework first, conclusions later; allocation first, targets later; ETFs first, individual stocks later; emphasize risk-reward ratio" to generate a structured investment decision report. The report starts with global variable transmission analysis, gradually deducing the market theme, position attributes for each direction (defensive/core holdings/enhancement/trading), specific target recommendations (prioritizing ETFs), and an action list for next Monday. If you provide your current holdings, the report will automatically include a detailed portfolio diagnosis and clear rebalancing recommendations. The core goal is to help you make rational, executable investment decisions while controlling risk.

Self-Evolving A-Share Rotation
This skill provides A-share investors with a comprehensive strategy management and evolution platform, helping you systematically execute, validate, and optimize your trading strategies. It can intelligently adjust your monthly rebalancing strategy based on market conditions, and through rigorous backtesting, continuously evaluate strategy performance and provide in-depth diagnostics to ensure your investment approach stays in sync with the market. Using real-time market data analysis, this skill accurately identifies the current market environment (such as trending, range-bound, or bear markets) and applies preset parameter sets for stock screening. It employs a multi-layer funnel approach, starting with fundamental hard metrics to technical timing, then rigorous individual stock value analysis, and actively seeks counterevidence to avoid blind decisions. Ultimately, you receive an auditable candidate stock list, each with detailed rule-hit explanations, ensuring transparent and traceable decisions. Beyond strategy execution, this skill also offers powerful strategy validation and evolution capabilities. It automatically tracks and backfills your trading signal performance, generating detailed strategy health reports including win rate, profit/loss ratio, and excess returns over the CSI 300. When a strategy underperforms, it intelligently triggers evolution suggestions, performs attribution diagnostics to identify problematic rules, and supports parameter adjustments after paper trading validation to continuously refine your investment strategy. Notably, after each strategy execution or validation, this skill scans US, Hong Kong, and A-share markets to provide 'cross-market high expected value opportunities' with structural advantages. These opportunities are based on a rigorous expected value framework and come with clear entry, stop-loss, target, and position suggestions, but are not automatically written to your trading log. They serve as decision support references, helping broaden your investment perspective.
 Research
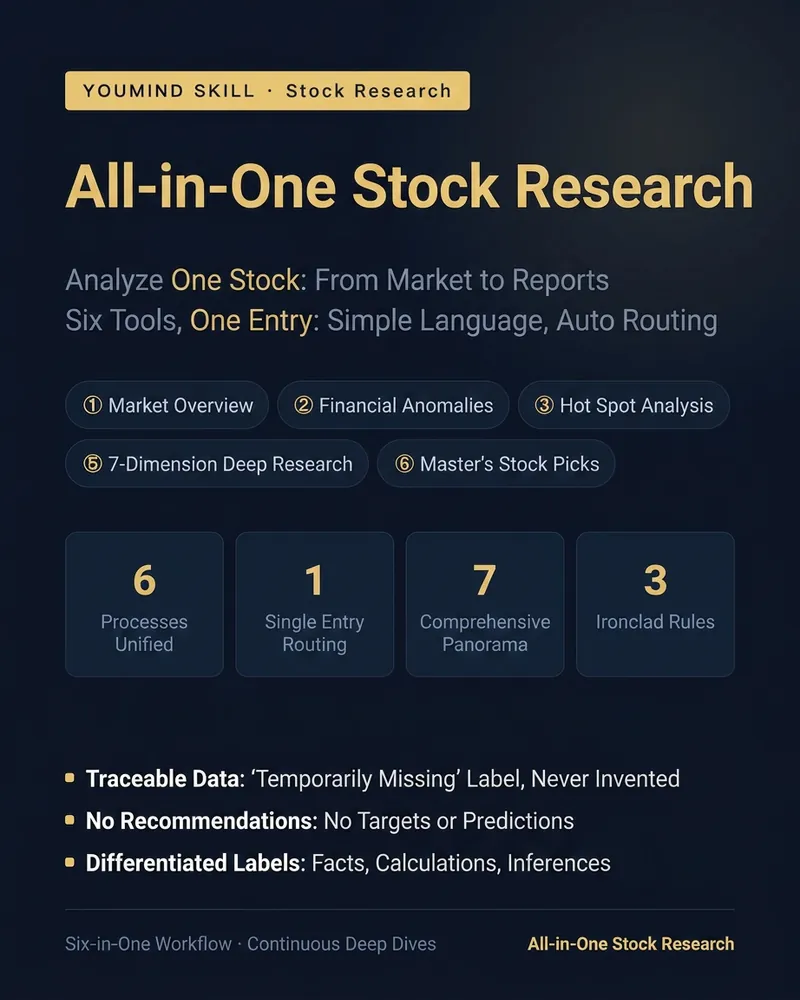
All-in-One Stock Research
Enter a stock name or ticker to get a one-page research snapshot: what the company does, which facts deserve attention, and where the evidence comes from. When you need more depth, switch to prices, financial statement anomalies, events, supply chains, deep research, or master checklists—without running the full set every time. For market data, the actual source time, trading status, and delay are specified; outside trading hours, the most recently verifiable closing value may be used. Financial comparisons distinguish currencies, periods, and accounting standards. Supply chain relationships distinguish disclosures, reporting, and speculation. Companies, market shares, or figures are never made up just to fill a format. Supports A-shares, Hong Kong stocks, and U.S. stocks. When sources are unavailable, gaps are preserved; not all market metrics are guaranteed to be available. No stock recommendations or target prices are provided, and master checklists are not treated as investment scores.
Information
- Version
- v2
- Last updated
- Runtime credits
- Usage-based
- Models
- Auto
- Use cases
- Research & analysisInvestment & finance
- What you get
- ReportPlanData