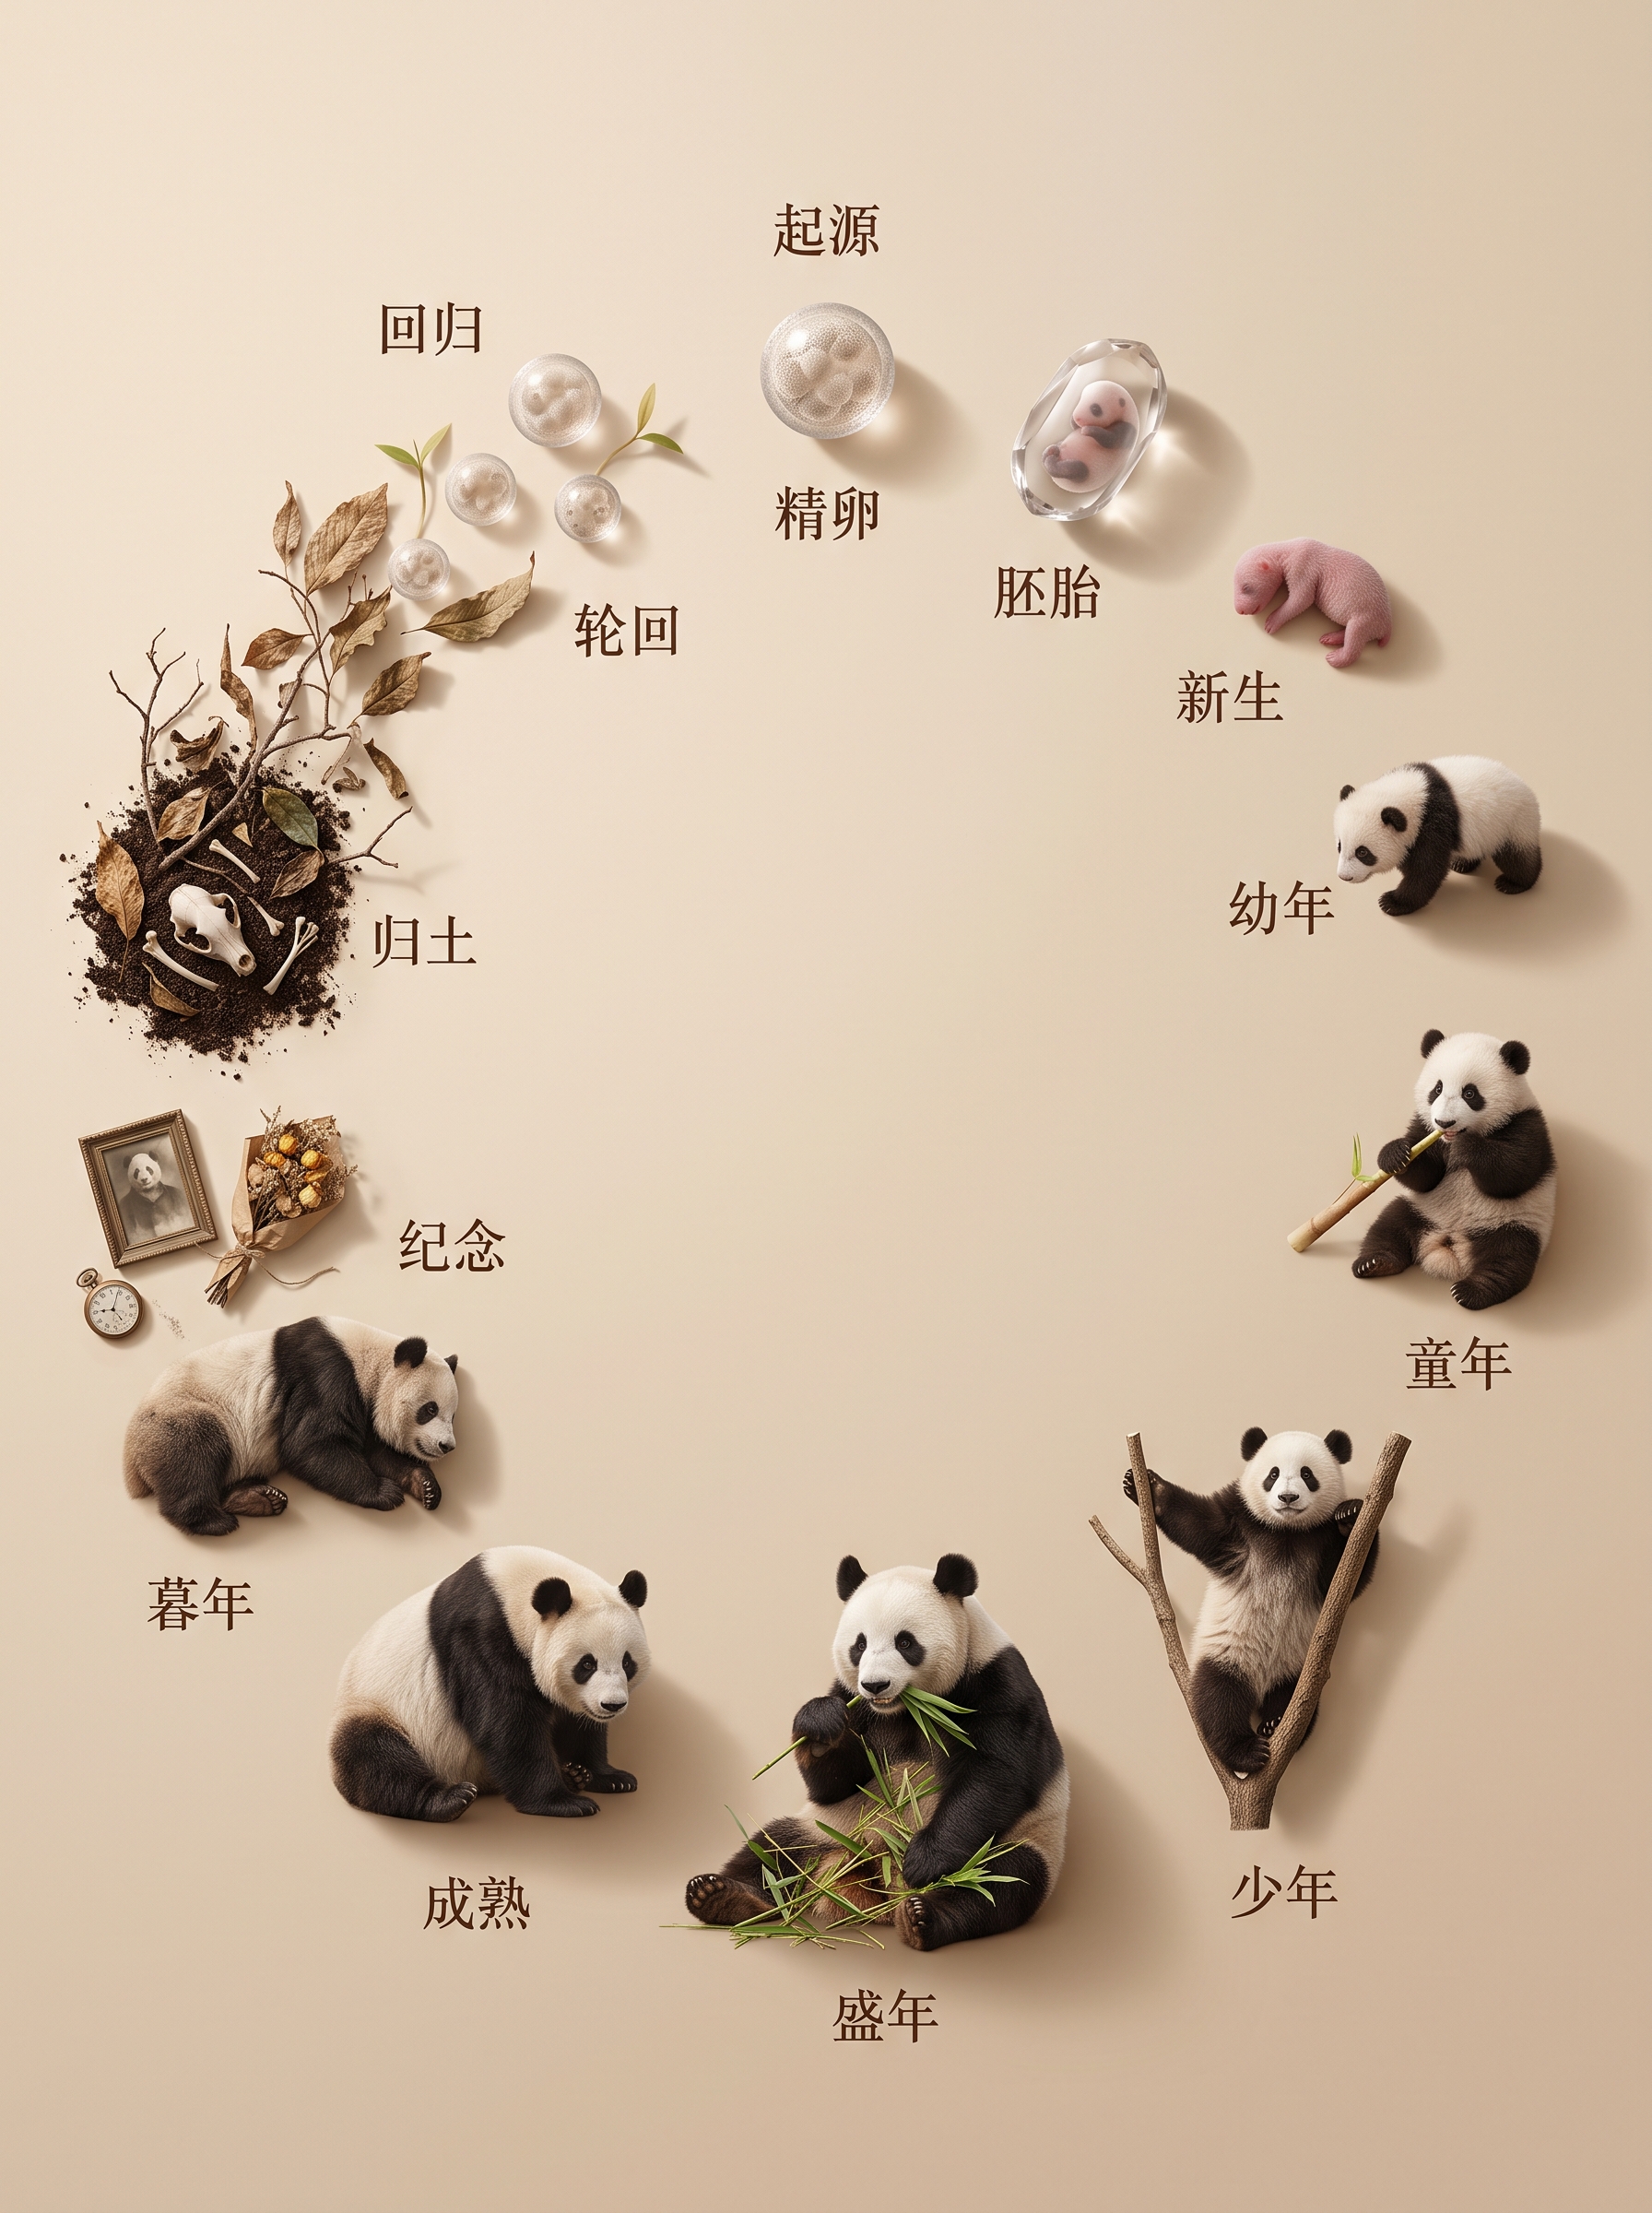
Viral Circle of Life
Enter any species to map its life cycle
Viral Circle of Life
Enter any species to map its life cycle
Showcase
Description
Ideal for series content about life education, emotional healing, and memorial tributes. Enter any name—human, animal, plant, insect, fish, or flower—to generate a photorealistic, top-down life cycle image on a beige background. The image shows every authentic stage of the life form, from its origin, fertilization or germination, and embryo stage through birth, growth, prime, aging, and eventual return to the soil. Each stage is arranged one after another in a complete circle, with the end of one life nurturing a new beginning in an endless cycle. The system automatically identifies the species category and creates the image according to its real life history. Each stage features a specific, accurate biological form with Simplified Chinese stage labels.
Recommended by
Dancang
Why we love this skill
Transforms any organism’s true life history into a closed-loop, ultra-realistic overhead image that combines scientific accuracy with visual storytelling.
Best for
Visual content creators focused on life education, emotional healing, and memorial tributes.
How to use this Skill
Provide your input
Enter a biological name; you can also add a category or visual requirements.
Run the Skill
The system uses the organism’s life history to generate a top-down, closed-loop life cycle image.
Review your result
Get a photorealistic life-stage image on a warm beige background, with Simplified Chinese stage labels.
Related Skills
View all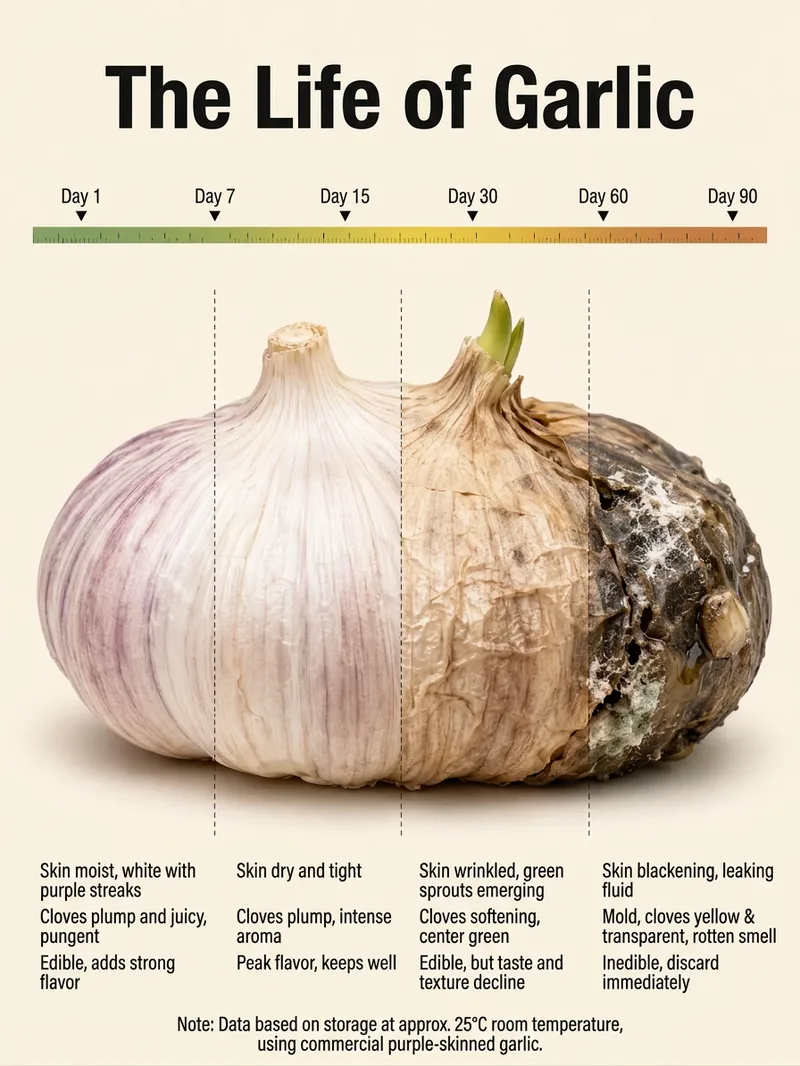 Image
Viral Food Science Infographic
Enter the name of a food, vegetable, fruit, or organism to generate a “Life of XX” ripeness and spoilage guide. It’s suitable for posting on Xiaohongshu and Douyin, and for creating a series of food science infographics. Each poster uses a consistent vertical layout, warm beige background, and clean, refined visual style, keeping different topics neat and cohesive when displayed together for easy ongoing updates and collection. The guide presents the subject’s natural progression at room temperature—from unripe and ripe to overripe and spoiled—along with a storage timeline. This helps readers clearly understand changes in appearance, internal condition, the best stage for eating, and what to do after spoilage. The central subject emphasizes how the same food naturally changes over time, while the information stays concise and easy to read, balancing educational value with visual appeal. You can simply name a food or ask for “Create a guide to XX” or “The life of XX” to make content about avocados, bananas, tomatoes, garlic, apples, and more. If you haven’t chosen a subject yet, just provide the name you want to create.
 Image
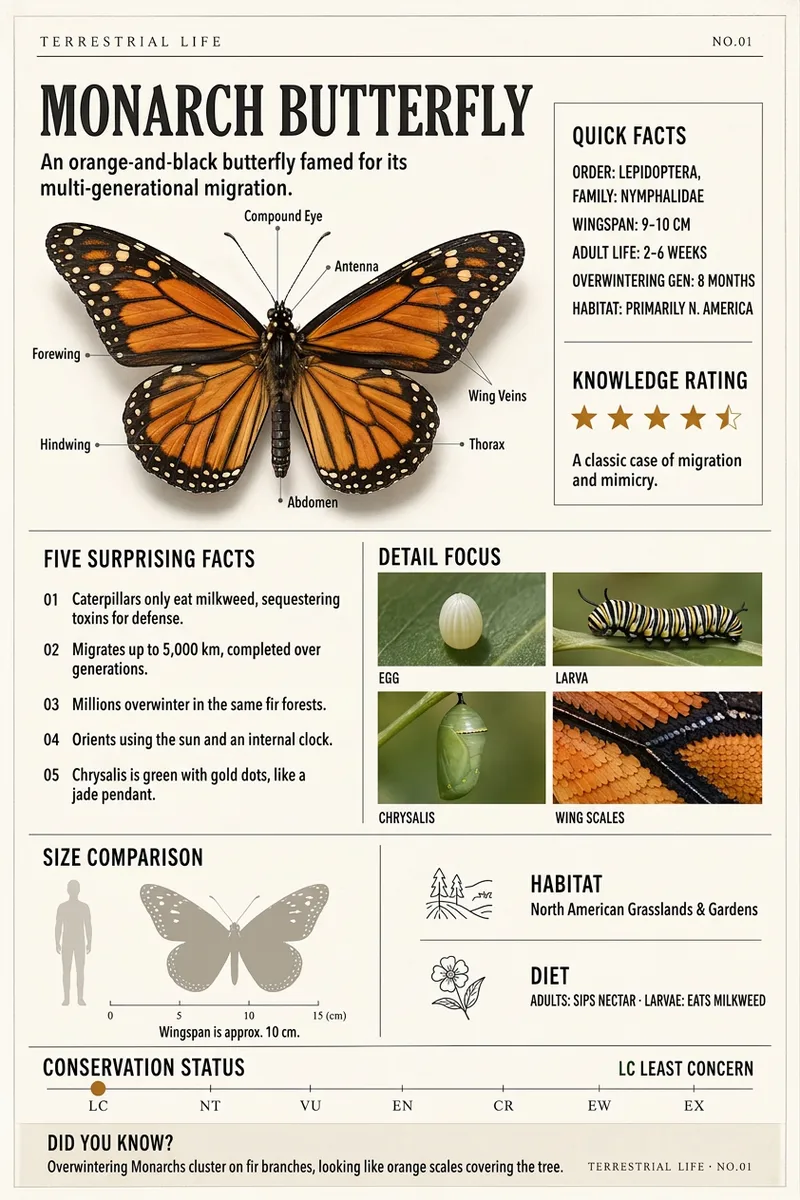
Terrestrial Life Infographic
Transform any species, plant, fungus, aquatic organism, or structurally distinctive artifact into a 2:3 vertical infographic tailored for classrooms, exhibitions, and natural history communication. Whether you provide just a name, a brief description, a photo, or a thematic direction, you will receive a clear subject profile, reliable classification or background details, and ready-to-use content materials. The final layout centers on a realistic 3D primary visual, accompanied by 5 to 8 key anatomical callouts, a quick summary, surprising facts, a size or everyday-object scale comparison, knowledge ratings, a four-panel detail close-up, and a trivia footer. Living subjects also feature habitat, diet, and conservation status, while artifacts include origin and era, usage scenarios, and preservation status. Designed with restrained academic colors like paper white, beige, and ochre, it captures the visual aesthetic of modern natural history museum exhibits and scientific journal plates, perfect for building a cohesive science series.
 Image
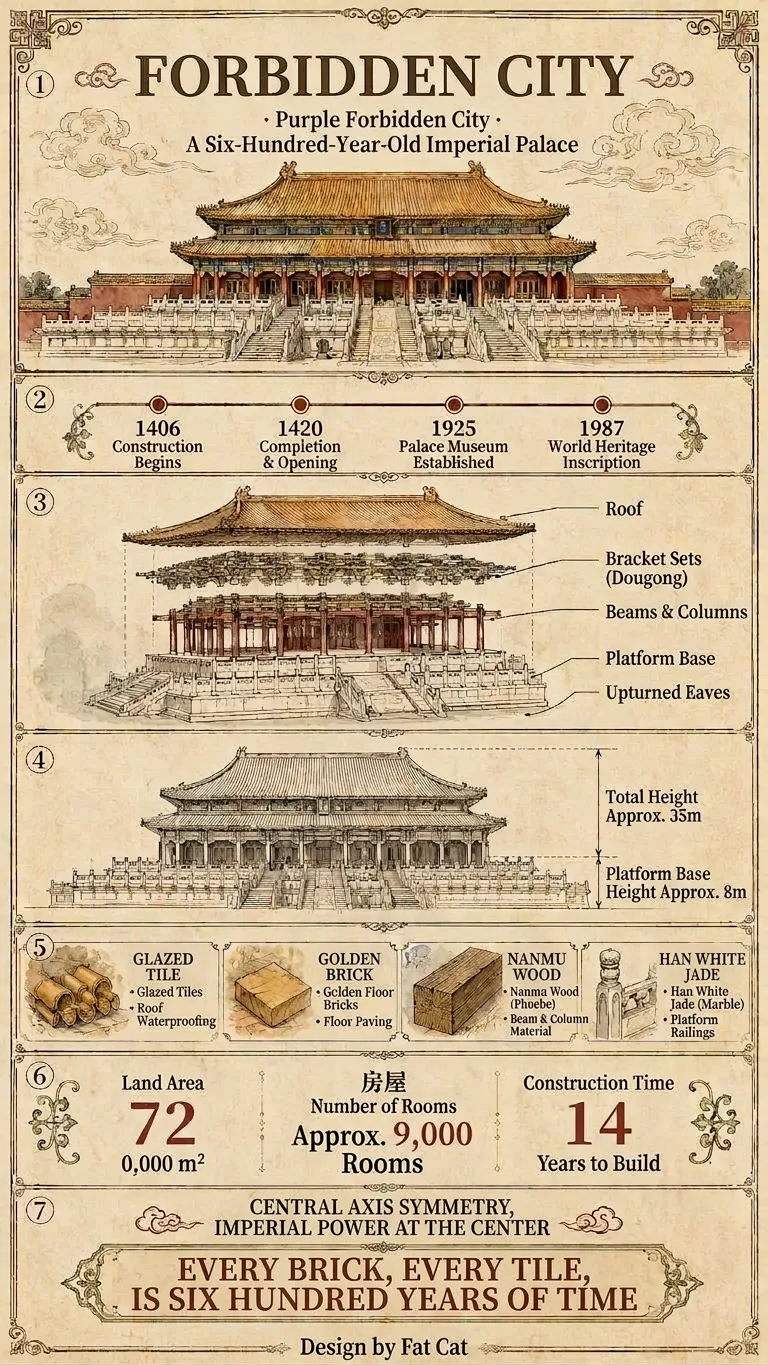
Viral Everything Infographic
Enter a topic, and it will automatically identify the category, verify key facts online, and generate the copy. By default, it outputs a vertical, extra-long “Universal Deep-Dive” infographic (9:16) that explains “timeline · structure · diagrams · legend · data · humanities” in seven fixed sections. The diagrams adapt to the category: architecture gets engineering drawings, animals get anatomy and distribution maps, and people get relationship and achievement charts. When you need something lighter, you can switch to the “Standard Science” version (3:4). Both versions use the same style, fonts, colors, and borders, so they can be posted directly on Douyin or Xiaohongshu to start building your account.
Information
- Version
- v3
- Last updated
- Runtime credits
- Usage-based
- Models
- Auto
- Use cases
- Writing & contentImages & designLearning & education
- What you get
- Image
- Visual styles
- Photorealistic