
Physics Lab Blueprint Maker
Create hand-drawn physics lab blueprints
Physics Lab Blueprint Maker
Create hand-drawn physics lab blueprints
Showcase
Description
SKILL features Model selection card: First determine which model to use (particle / rigid body / point charge / ideal gas / thin lens), then discuss the relevant laws to avoid the biggest source of lost points: applying the wrong formula. Process breakdown: Divide each physics process into three stages—“state–process–law”—and label the knowns, unknowns, and applicable laws for each stage. Step-by-step force, circuit, and ray diagrams: Provide text-based drawing instructions, including what to draw first, what to draw next, and how to determine directions, along with hand-drawn-style diagrams. Graph-based methods: Explain the physical meaning of slopes and areas in v-t, F-a, U-I, and p-V graphs, with a three-step guide to “reading answers from graphs.” Dimensional and order-of-magnitude checks: Automatically check unit consistency and whether results are reasonable (for example, flagging a calculated car speed of 300 m/s as a warning). Approximations and neglect conditions: Clearly explain “why air resistance / friction / internal resistance can be neglected” to build modeling awareness. Real-life connections: Include one safe, easy-to-verify everyday phenomenon or small experiment for each chapter, with no specialized equipment required. Multiple detail levels: Middle school concept version / high school exam version / advanced competition and academic foundations version (including infinitesimal-element methods and estimation). Recommended prompts Turn “connected-body problems using Newton’s second law” into an engineering blueprint, with a model selection card Organize “circular motion of charged particles in a magnetic field,” including a process breakdown and critical-radius analysis Create a U-I graph-based lab notebook for “Ohm’s law in a closed circuit,” clearly explaining the slope and intercept Turn “the ideal gas law and p-V graphs” into a laboratory notebook-style page, including comparisons of three processes Create a high school blueprint for the “two-rod electromagnetic induction model,” with a dimensional self-check
Related Skills
View all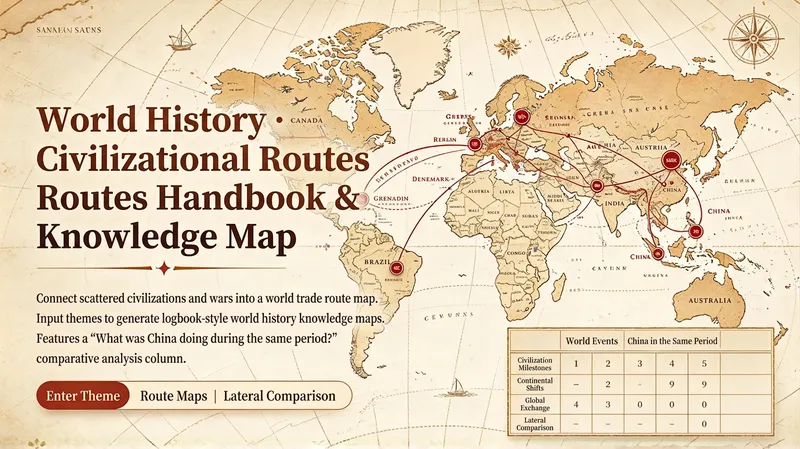
World History Route Atlas
SKILL features Civilizations as routes: river civilizations become harbors, imperial expansion becomes sea lanes, the spread of ideas becomes monsoons, and revolutionary waves become ocean currents. Cross-period and spatial comparisons: It always includes “China at the same time,” addressing the challenge of remembering world history in isolation (for example, the 1689 English Bill of Rights ↔ the 28th year of the Kangxi era). Calendar conversion: Converts between BCE/CE, centuries, reign titles, and the Gregorian calendar, with automatic labeling and error correction. Name standardization: Combines different translations of the same person under one entry (Charlemagne/Charles the Great, Catherine II), avoiding different names in different books. Concept distinctions: Provides comparison tables for Renaissance/Enlightenment, bourgeois revolution/Industrial Revolution, and colonialism/globalization. Make causal chains explicit: Breaks “background—trigger—process—result—impact” into five stages of a voyage to prevent memorizing conclusions alone. Map-reading practice: Includes three steps for “how to identify test points from the map,” supporting both understanding and exam-oriented map reading. Multiple levels of detail: The middle school version emphasizes narrative, the high school version emphasizes concepts, and the college/graduate exam version emphasizes historical perspectives and sources. Recommended prompts Turn the “Age of Exploration” into a great-voyage-log-style map and include a comparison with China during the same period. Create a route map comparing the “two Industrial Revolutions,” with concept distinction cards. Turn “Politics and culture in ancient Greece and Rome” into a civilization-harbor-style journal. Organize the “Versailles–Washington system” in a war-map style, clearly marking the layers of cause and effect.
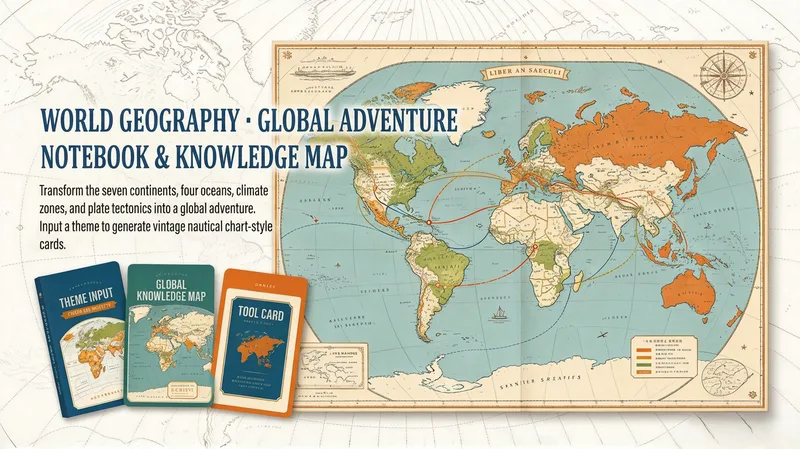
World Geography Explorer
SKILL features Plate tectonics and landform visualization: Show plate boundaries, rifts, and collision zones, with mountain ranges, volcanoes, and earthquake belts arranged along the boundaries to explain “why here.” Climate classification cards: Use the three-step method of latitude—atmospheric circulation—surface conditions, with typical vegetation and representative cities. Ocean currents and fishing grounds: Present warm and cold currents, convergent fishing grounds, and their effects on coastal climates together. Time-zone and date-conversion cards: Provide calculation steps and a worked example to solve common sources of lost points. Country–capital–key product trio: Output matched sets with memory anchors. Regional development comparison: Show structural differences between developed and developing countries, and between resource-based and processing-based economies. Latitude-longitude grid reading: Teach users to infer climate and seasons in each hemisphere from coordinates. Optional bilingual terms: Add Chinese and English for important landform regions and continents and oceans, making the materials useful for international courses and map reading. Suggested prompts Turn “the distribution and causes of world climate types” into a climate-zone crossing nautical chart, with the three-step interpretation method Help me create a plate-drift adventure map of “plate tectonics and volcanic and earthquake belts” Organize “the distribution of ocean currents and their effects on the geographic environment” in a global-voyage style, with fishing grounds marked Generate a time-zone and date-conversion method card with one complete worked example
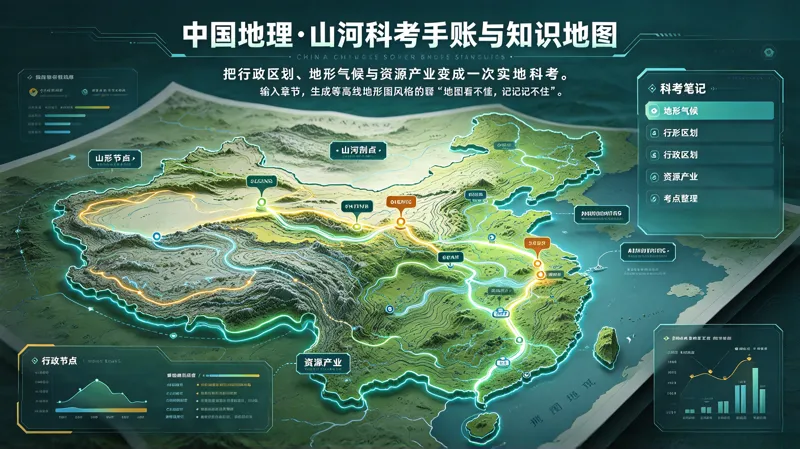
China Geography Knowledge Map
SKILL Features Terrain profiling: Turn the three-step topographic ladder into a “mountain-climbing profile” so elevation changes are immediately clear. Dynamic monsoons and river systems: Turn the advance and retreat of the summer monsoon, the movement of rain belts, and river flood seasons into a “weather itinerary.” Administrative division memory aids: Output provincial-level region outlines, abbreviations, and administrative centers in matching pairs, with homophone or association-based memory anchors. Human–land relationships: Connect natural features to agriculture, industry, transportation, and cities through an unbroken chain of cause and effect. Regional comparison tables: Compare southern and northern China, as well as the Northwest and Qinghai–Tibet regions, item by item, including climate, terrain, crops, and housing. Data verification: Mark the source of figures such as area, length, population, and output, or label them “To be verified.” Never fabricate numbers for the user. Chart interpretation: List the steps for reading isotherm maps, isohyet maps, and population density maps separately. Local geography interface: Specify a province to generate a dedicated one-page field study sheet connected to exams and everyday life. Recommended prompts Turn “China’s Terrain and Topography” into a mountain-climbing field study-style contour map Help me create a river-drifting field notebook for “Comprehensive Development of the Yangtze River Basin,” including a human–land relationship chain 整理 “The Geographical Significance of the Qinling–Huaihe Line” with a regional comparison table Generate a local geography field study sheet for Guangdong Province, with a map styled as a railway mainline journey
Information
- Version
- v2
- Last updated
- Runtime credits
- Usage-based
- Models
- Auto
