
PolyMarket Trend Scout
Find hidden narratives via betting interest
PolyMarket Trend Scout
Find hidden narratives via betting interest
Showcase
Description
Through PolyMarket's public Gamma API, data is pulled in real time. Using one of three modes—'Contrarian Signals', 'Interest Targeting', or 'Comprehensive Scan'—it generates a Bloomberg Terminal-style daily intelligence webpage in Chinese. Default mode = Contrarian Signals: captures events with drastic odds shifts, opposite to media narratives, or broken consensus, for Chinese content creators.
Recommended by
nene@YouMind
Why we love this skill
It precisely captures market 'contrarian' signals from the noise of PolyMarket, providing exclusive topic ideas for content creators, avoiding mainstream trends, and truly discovering unreported truths.
Related Skills
View all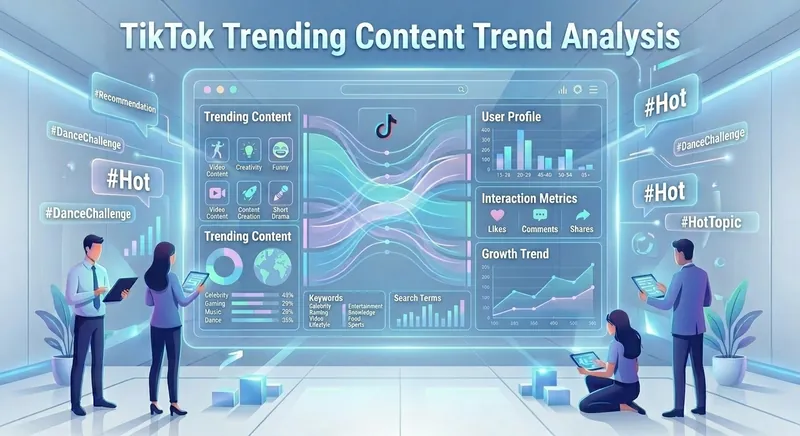 Research
Douyin Hot Trend Analysis 2.0
Real-time insights into trending topics on China's Douyin platform, providing content creators with in-depth trend analysis and actionable advice. This skill retrieves hot data from across the web and cross-validates it with Douyin's official trending list, ensuring the information is highly timely and accurate. It precisely captures currently viral hashtags, popular background music (BGM), and well-received content formats, helping users quickly locate creative inspiration in the rapidly changing short-video ecosystem. For each hot trend, the skill generates a structured professional report. The report includes a one-sentence trend summary, breakdowns of the top 3 viral trends, a list of promising music tracks, and specific video template suggestions. Whether you're looking for viral topics, analyzing content styles, or optimizing engagement strategies, it provides creation guidance backed by real data. Users simply submit an analysis request to receive a Markdown report with actionable recommendations, helping you precisely grasp the key to viral traffic and improve content marketing efficiency.
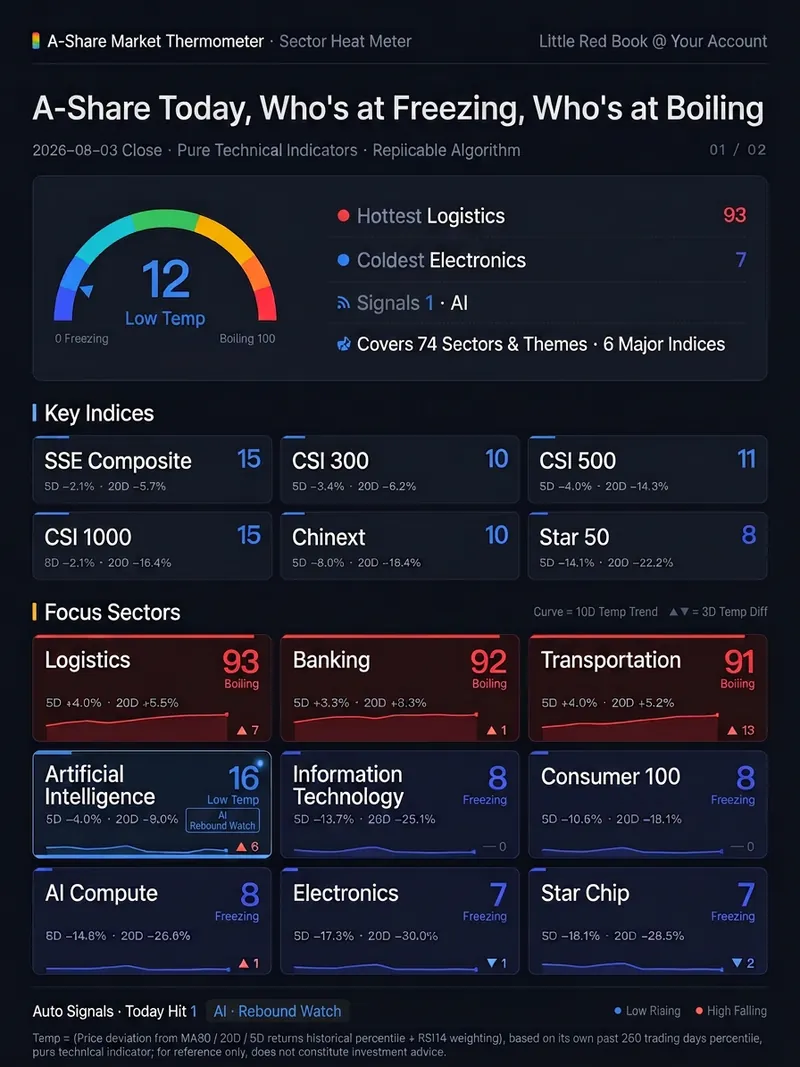
A-Share Market Thermometer
One command after the close delivers **a web page that does the calculation itself**: within 1–2 seconds of opening, it concurrently pulls 80 daily K-line data points in your own browser, scores the 6 major A-share indices plus 74 industries and themes on a 0–100 temperature scale, and renders the results as a two-page, 1080px-wide dashboard long image—ready to screenshot for Xiaohongshu or WeChat Official Account. Data goes through no intermediary and doesn't rely on an author-provided data source—your browser connects directly to the market data interface. So every time you open it, you get the latest live market data, not a static image that expires the next day. The temperature isn't “AI intuition”—it's a formula hard-coded in the page source. For the three factors—price deviation from MA60, 20-day returns, and 5-day returns—each one takes its own historical percentile over the past 250 trading days, and then RSI14 weighting is added. It uses percentiles rather than absolute gains/losses because banks may move 20% a year while theme sectors move 200%; only by converting to each one's historical position can they be compared on the same scale. Real example: on the same day, the finance & real estate and green power sectors had nearly identical 5-day and 20-day gains and sat right next to each other in the gain rankings. But their temperatures were 87 (high heat) and 50 (neutral)—because the former had risen above MA60 and hit its hottest level in a year, while the latter was just a small rebound after a deep drop. Seven qualitative levels: Ice Point / Low Temperature / Slightly Cool / Neutral / Warming / High Heat / Boiling Point. Automatic signals: temperature ≤20 and a rise of ≥5 degrees in the past 3 days = rebound watch; temperature ≥80 and a drop of ≥5 degrees in the past 3 days = pullback watch. Thresholds are hard-coded; if none are hit, it reports zero—it doesn't force a match. All 80 are publicly released CSI/CNI standard indices, with the code list hard-coded in the page. The algorithm is in the source code—you can inspect and reproduce it yourself. The same closing data always produces the same number no matter who runs it. It only measures temperature for indices and sectors, not individual stocks. It only presents hot/cold distributions and pattern signals; it does not recommend stocks, predict price movements, or constitute investment advice. Trigger words: market temperature / A-share thermometer / sector temperature / sector heat / market sentiment / sentiment indicator / is the market cold today / freezing point / boiling point / market overview / sector rotation / post-close review / temperature dashboard / market thermometer
 Research
Niche AI Product Radar
A systematic engine for discovering niche AI product opportunities, v3.1. It combines the mathematical rigor of v2.0 with the execution methodology of App Gold Mining: a five-level anchor scale and logarithmic demand-intensity scoring, category-weighted supply scarcity, signal time-decay functions, competitive response and platform-risk game analysis, and a Bayesian prior-to-posterior validation framework. v3.1 adds the SonarPing supply-side detection layer, incorporating its daily scans of new AI products, elimination of wrapper and lookalike products, hands-on testing, and time-series snapshot data. It filters out ineffective competitors from nominal supply, calculates the effective supply rate, new-product entry speed, and deactivation speed, and upgrades the static half-life into a dynamic opportunity window driven by real supply flows. It integrates data from 130+ Chinese Twitter creators, Chinese-language communities, and payment behavior as high-quality demand signals, helping indie developers identify low-competition, high-pain-density opportunities in AaaS and B2C subscription products, and produces actionable radar reports and promotion-channel matrices.
Information
- Version
- v4
- Last updated
- Runtime credits
- Usage-based
- Models
- Auto
