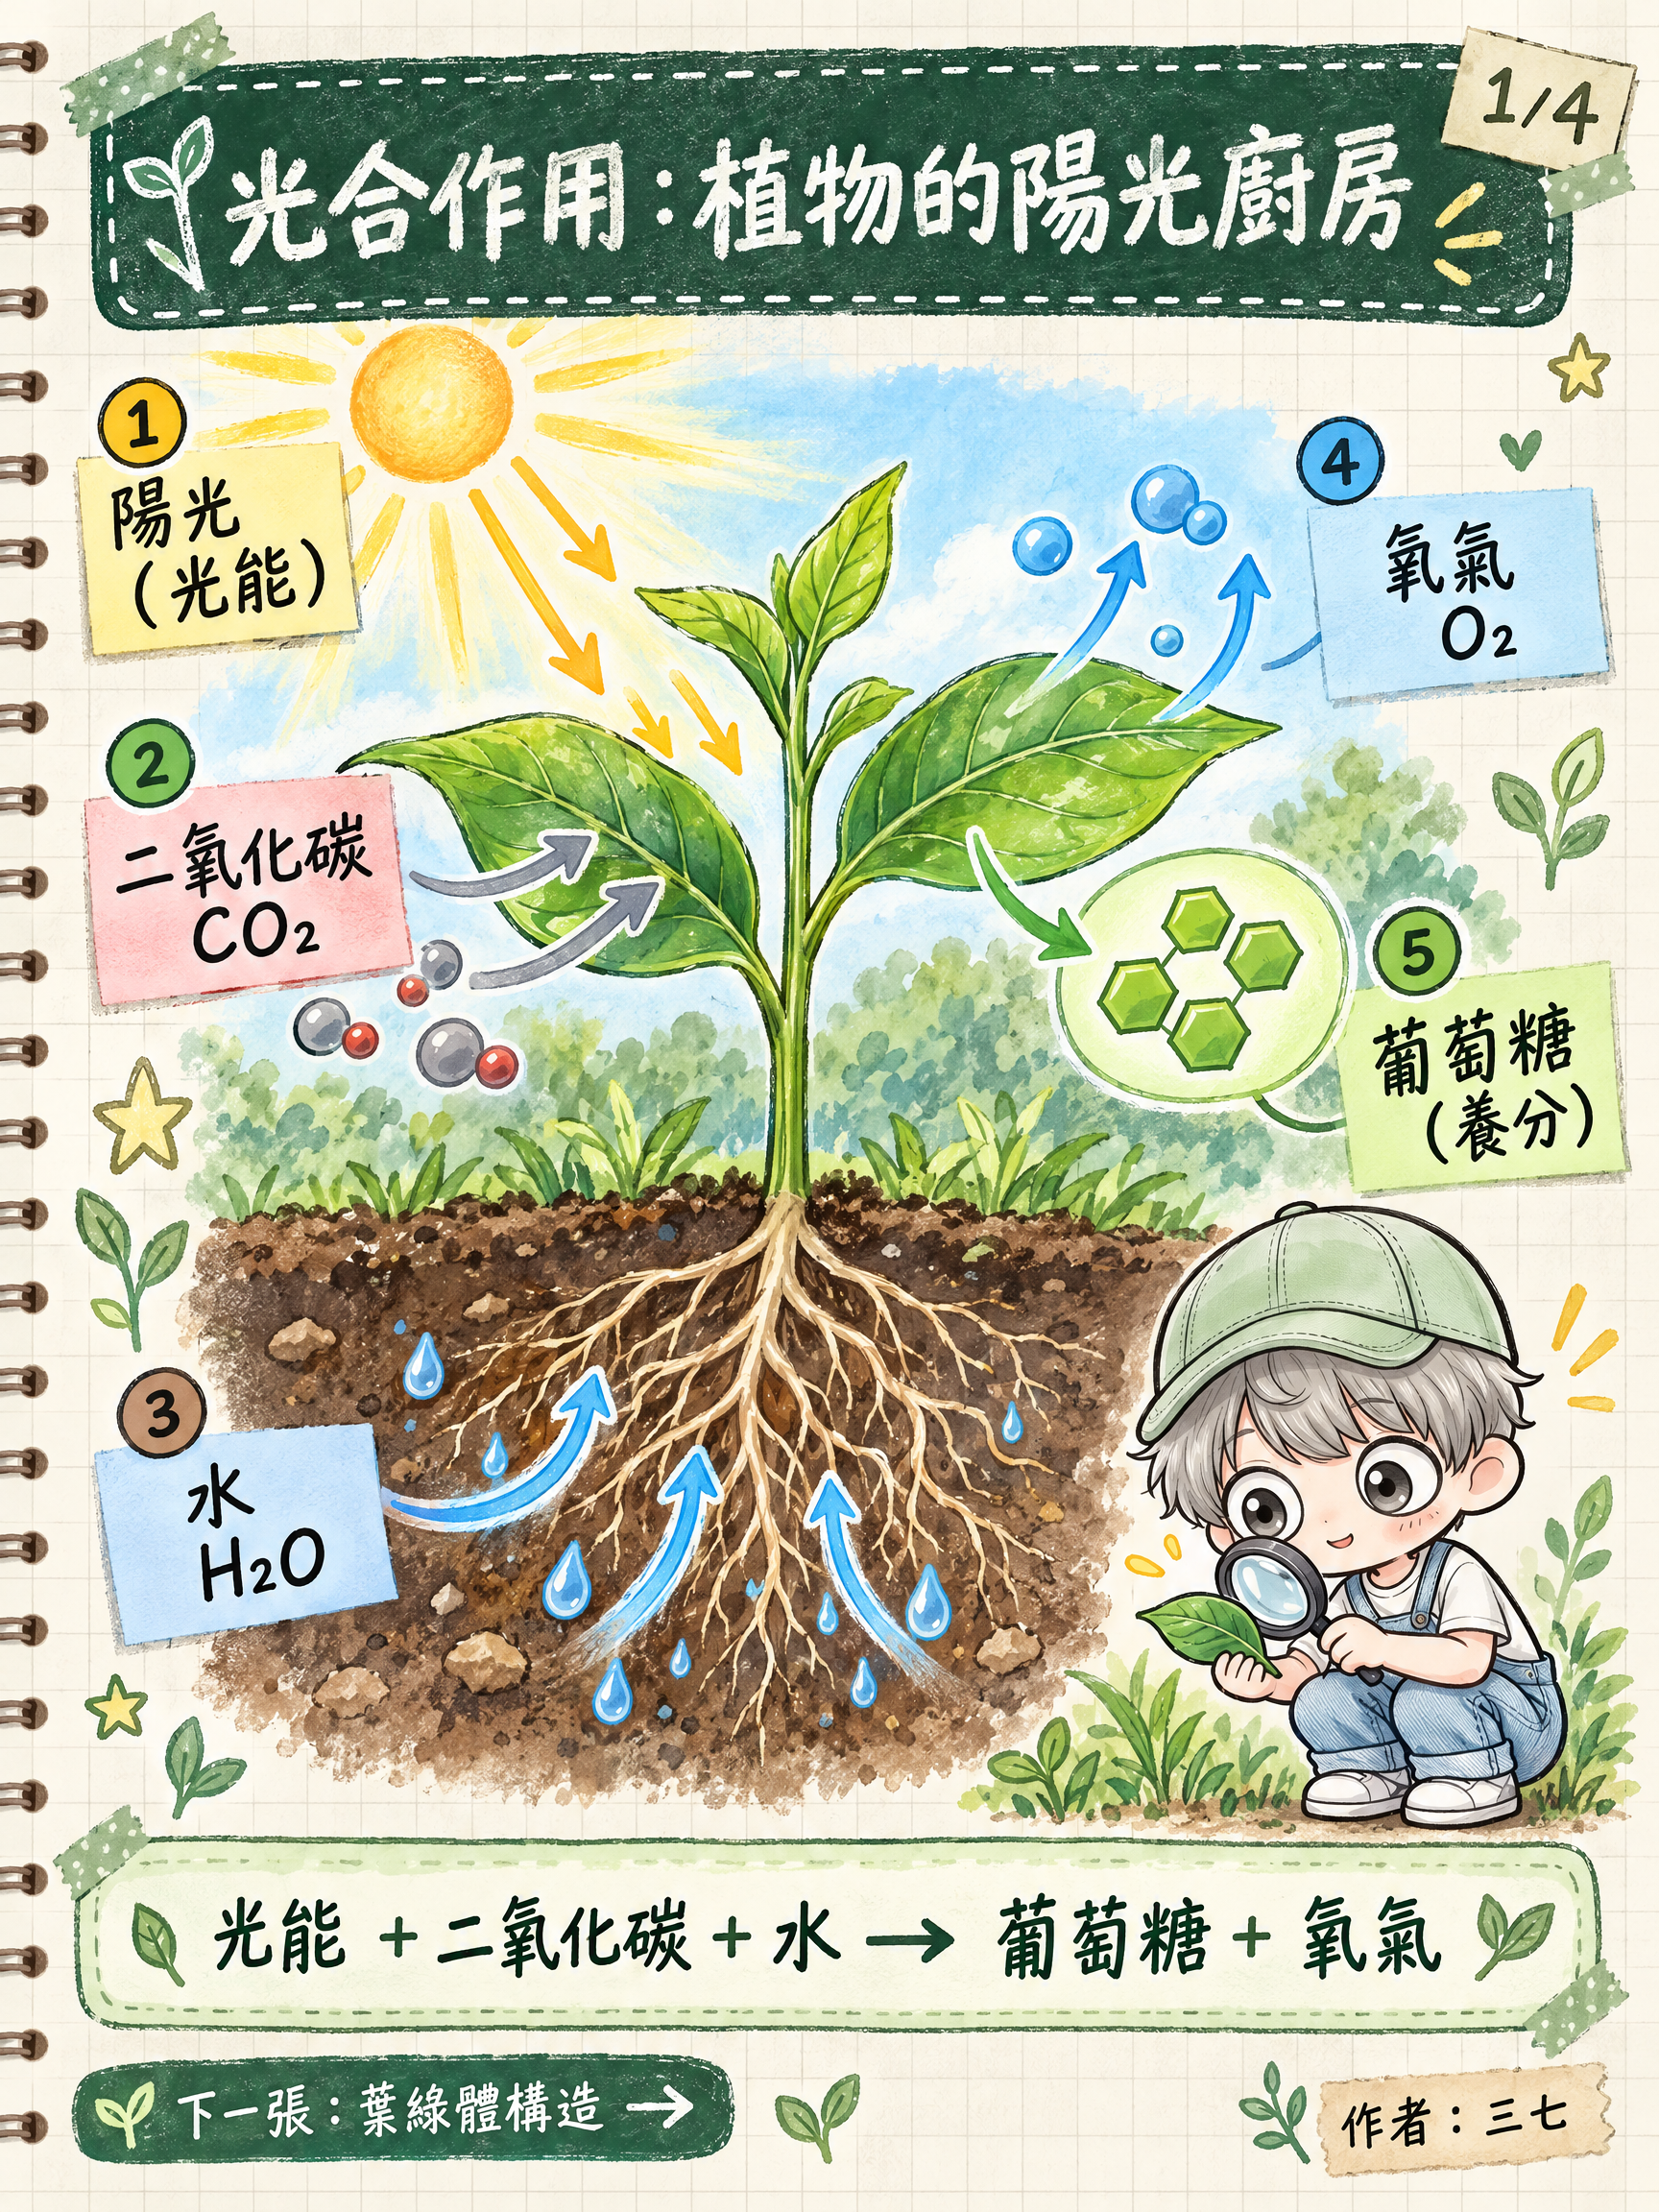
Science Illustration Series
Turn any topic into a 3-4 part hand-drawn infographic
Science Illustration Series
Turn any topic into a 3-4 part hand-drawn infographic
Showcase
Description
This skill takes a single topic and delivers a complete set of ready-to-publish science infographics rather than isolated single images. What it can do: - Automated series planning: Overview -> Structure -> Principle -> Connections and Summary. Each image covers one clear point, complete with page numbers, unified color palettes, and "Next" previews. - Fact-checking before drawing: Organizes a fact checklist first, verifying process order, arrow directions, and spatial orientation. Uncertain numbers are omitted or marked as "approximate" rather than guessed. - Multilingual localization: Supports Simplified Chinese, Traditional Chinese, Japanese, Korean, English, Spanish, French, German, Portuguese, and more. It rewrites content naturally for local audiences rather than direct translation, adapting terminology, punctuation, and grade-level labels. - Unified style: Cream-colored notebook paper, dark green chalkboard headers, washi tape, sticky notes, hand-drawn annotations, and realistic scientific illustrations. Pastel and dark chalkboard variants are also available. - IP-free by default: Keeps visuals clean. To add a mascot, simply upload a character image or text description to keep the character consistent across the entire set. - Aspect ratios: Default is 3:4, with support for 9:16, 4:5, 1:1, and 16:9. - Model matching: Defaults to top-tier image quality settings, switchable for strong consistency, pure Chinese output, or fast drafts. - Exportable prompts: Complete prompts for each image can be copied directly for use in other tools. Best for: - Science graphic creators on platforms like Instagram, TikTok, and Xiaohongshu - Teachers and educational institutions making slide decks, review cards, and knowledge posters - Global creators managing multilingual accounts - Content teams looking to batch-produce science series Suitable topics: - Human body and health (circulation, digestion, immunity, sleep), biology and nature, physics and chemistry, earth and universe, history and culture, tech and AI basics. Notes: - Health content is for educational purposes only and does not constitute medical advice, diagnosis, or dosage instructions; local-language disclaimers will appear on the graphics. - AI image generators may occasionally make errors with small text, so the skill checks images one by one with automatic retries. A final review before publishing is recommended. - Generates 3-4 images at a time; additional content can be created as a second series.
Recommended by
Dancang
Why we love this skill
Transforms any science topic into 3–4 connected hand-drawn note graphics, combining fact-checking, narrative storyboarding, and multi-language localization into a seamless workflow.
Best for
Ideal for science content creators, teachers, educators, and teams producing multilingual knowledge graphics.
How to use this Skill
Provide your input
Provide a science topic and optionally specify the language, audience, aspect ratio, number of images, visual style, or mascot character.
Run the Skill
The system organizes the topic facts, plans a coherent sequence of illustrations, localizes the text and visual elements, and generates and checks the images one by one.
Review your result
Receive a cohesive set of illustrated science graphics featuring page numbers and transition cues, along with copyable prompts for each image.
Related Skills
View all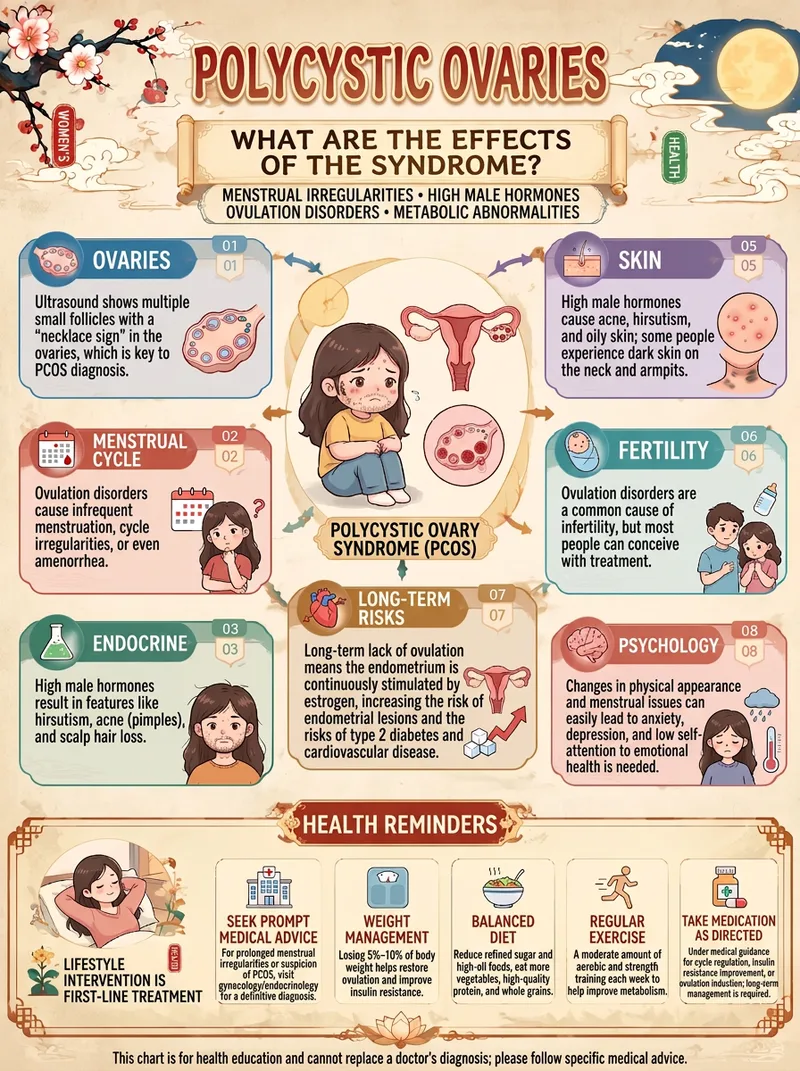
One-Click Health Infographic
Enter just one topic to transform complex health knowledge into an elegant Chinese-style educational infographic. You can use it to create: • Guides to the five internal organs, other body organs, and their physiological functions • Explainers on bodily changes caused by staying up late, insomnia, fatigue, and more • Guides to hydration, diet, nutrition, and healthy lifestyle habits • Everyday health knowledge about exercise, prolonged sitting, and weight management • Visual explainers on seasonal wellness, traditional Chinese medicine theories, and health culture Default: a distinctive modern Chinese visual style Rice-paper-inspired off-white backgrounds, traditional Chinese plaques, auspicious clouds, plum blossoms, seals, refined borders, cartoon organ illustrations, and modular knowledge cards create cohesive, polished visuals with a strong series identity. More than just attractive—the focus is also on knowledge quality It prioritizes the most representative knowledge from each topic and avoids piling on irrelevant information. Modern medical evidence is distinguished from traditional Chinese medicine theories, and health claims are not invented just to fill the layout. Flexible for different creative needs The default format is a 3:4 portrait layout. You can also specify 9:16, 4:5, 1:1, or 16:9, making it suitable for health education accounts, social media posts, short-video visuals, and series content. How to use it: Enter a topic → Extract key knowledge → Design the layout → Generate the image. No need to design from scratch—give every health topic its own visual guide. Note: Generated content is for health education and does not replace professional medical diagnosis or treatment advice. Medical content and text in images should still be verified before publication.
 Image
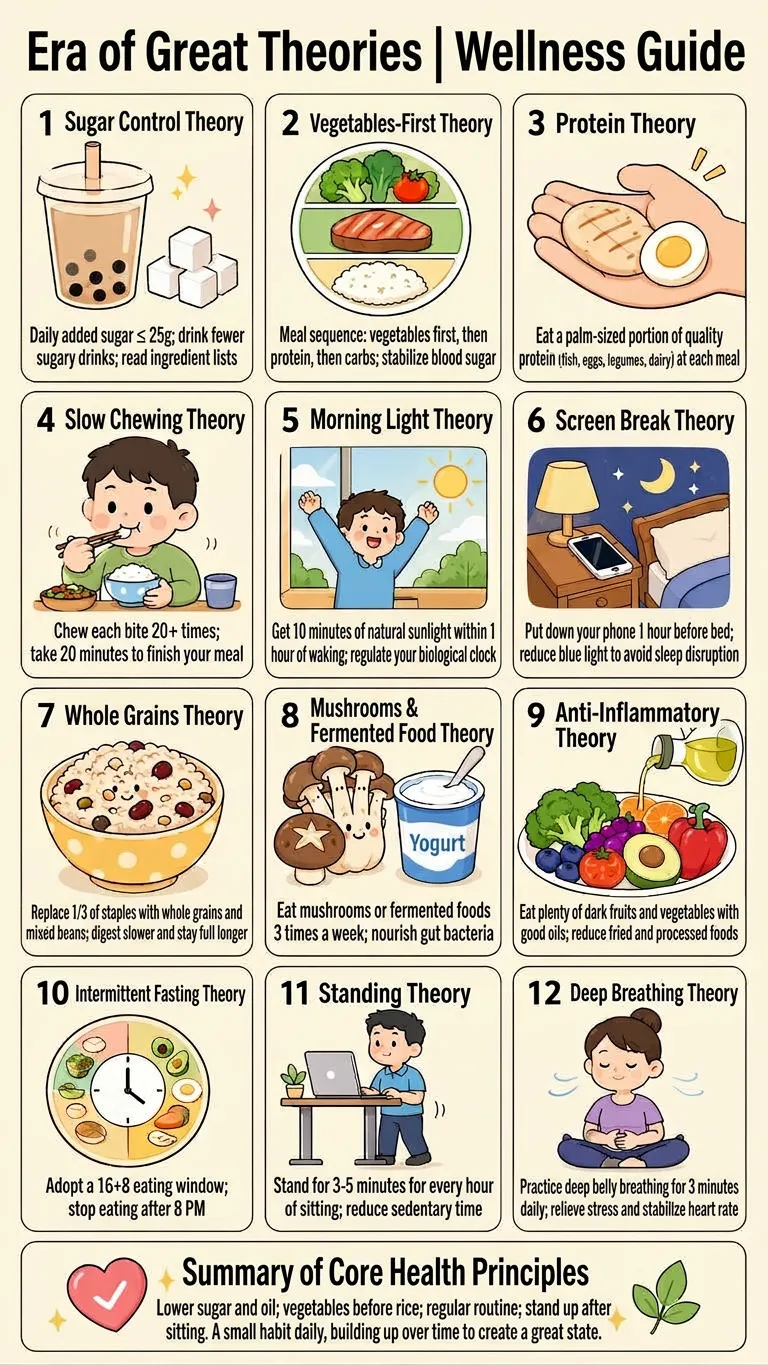
Viral Health Theory Slides
Just say “generate an image” to get a vertical health infographic suited for Xiaohongshu and Douyin. You can also specify the number of images and topics such as fat loss, sleep routines, diet, or office-worker health. Content is planned around current health and wellness trends to help you consistently create memorable, easy-to-understand “XX theory”-style educational content. Each image includes 12 distinct health theories covering everyday areas such as food, hydration, sleep, exercise, sun exposure, and bowel movements. Each point comes with a concise, positive, actionable suggestion that includes a number or frequency, along with a matching cute flat cartoon illustration. The content avoids medical diagnoses, claims of effectiveness, and absolute statements, making it better suited for sharing everyday health knowledge. The finished images use a 9:16 vertical mobile infographic layout, with a light beige background, rounded cards with thin black borders, and bright, soft pastel cartoon illustrations. Each includes a prominent topic title, 12 core content panels, and a summary panel at the bottom. When you need multiple images, each one uses a different combination of theories, illustrations, and colors, making it convenient for daily health content, launching an account, and preparing posts in batches.
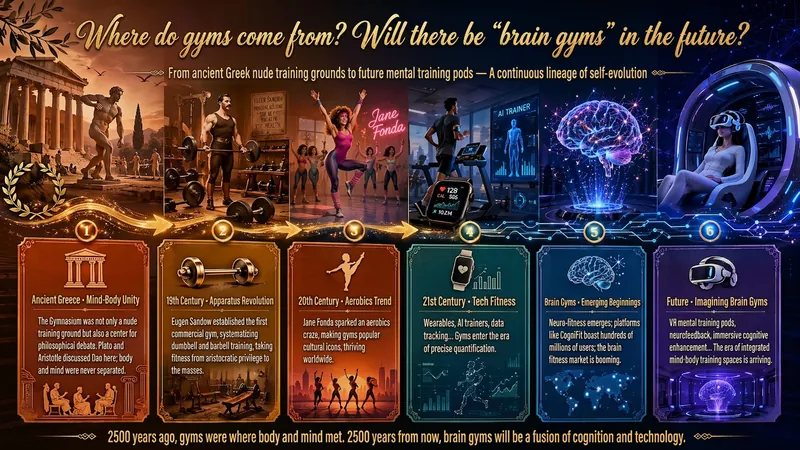
Idea to Infographic
A single image, a single sentence is all it takes. Have you ever had this experience—you have a great idea and want to turn it into an infographic like the ones big accounts post, but: - Open an AI image tool, rewrite prompts over and over, and the result either has terrible layout or completely mismatched style. - Tried several prompt templates, each requiring three or four adjustments, and half an hour later you're still not done. - Want styles like financial literacy, Chinese classic, science, tech... each time you have to research colors and layouts from scratch. Now you don't have to. 「Idea to Infographic」automates all of this: You say "make an emotion management infographic," and it decides whether to use a warm Chinese style or a healing scientific style, searches and organizes core knowledge points, breaks them into 6-8 module cards, assembles the optimal prompt, and quality-checks—if it fails, it automatically redoes; if it passes, it hands it right to you. Four killer capabilities, all built-in: 🧠 **Style Engine** — Not a rigid four-choice. If your topic matches financial literacy, it automatically goes with deep blue gold; if it matches Chinese classics, it uses rice paper and ink; if it matches technology, it uses cyan neon. For topics outside these four? It automatically synthesizes a new style. Coffee encyclopedia → food warm tones; exercise and fitness → vibrant orange gray. No style it can't handle. 🔍 **Content Brain** — You give a word, it searches the web to fill out content; you give a paragraph, it extracts the core; you give nothing but a topic, it organizes everything clearly. All three input methods are supported—the simpler, the more effortless. 📐 **Layout Adviser** — Progressive ladders, side-by-side comparisons, causal chains, overarching-subcategory radiation... Five logical patterns automatically matched. Not just stuffing text into an image, but actually designing an infographic. ✅ **Self-Inspection** — After generating, it automatically checks layout, text density, image-to-text ratio, and style match. If there's an issue, it adjusts and regenerates, up to two times. You don't need to know how to write prompts; you just need to know how to speak. **Who is this Skill for?** - Social media creators who need to produce images daily but don't want to learn design. - Knowledge commerce creators who want to visualize course content but lack a designer. - Corporate trainers who need professional infographics but lack budget for outsourcing. 🔍 - Anyone who wants to turn an idea into a great image. In a word: You have the idea, it has the image. All the hassle in between, it handles for you.
Information
- Version
- v5
- Last updated
- Runtime credits
- Usage-based
- Models
- Auto
- Use cases
- Images & designLearning & education
- What you get
- ImagePromptPlan
- Visual styles
- Hand-drawnPaper art