
7-Step Data Analysis
Guide for ops & product: data to insights
7-Step Data Analysis
Guide for ops & product: data to insights
Showcase
Description
Break down a complete data analysis into seven steps, each with specific deliverables and passage criteria: 1. Entry and business hypotheses, 2. Data health check and cleaning, 3. Descriptive analysis (comparison, trend, distribution), 4. Breakdown and attribution, 5. Conclusion reliability check, 6. Charts and presentation, 7. Delivery template, pitfall self-check, and stopping conditions. Supports uploading Excel or CSV files to check data health before analyzing, asking one question at a time when information is missing. Each step includes minimum viable snippets for Excel, SQL, and Python. Suitable for experienced professionals in operations, product management, marketing, and finance. Trigger phrases: help me look at this data, why did the conversion rate drop, reasons for metric decline, attribution analysis, data cleaning, is this conclusion reliable, how to present an analysis report to leadership, business hypotheses, data visualization, correlation.
Best for
Experienced operations, product, marketing, and finance professionals turning business questions into actionable data conclusions.
How to use this Skill
Provide your input
Upload an Excel or CSV file and provide the business decision, analysis question, or conclusion to verify; include definitions, timeframes, and field notes if available.
Run the Skill
Proceed through seven steps: define questions and hypotheses, inspect and clean data, compare and break down metrics, test conclusion reliability, plan presentation, and deliver the final output, focusing on one question per round.
Review your result
Receive a verifiable analysis delivery draft containing metric definitions, inspection and cleaning logs, key findings, attribution evidence, limitations, recommended actions, and follow-up verification plans.
Related Skills
View all
Data Analysis Pipeline
📊 From raw Excel to reports with charts, all in one pipeline—no more jumping between multiple tools. 🔁 Four-stage analytical relay (AI automatically switches analysis style—no need to manually change models): 🧹 Data cleaning: automatically handles nulls, outliers, formatting, and duplicates, outputting clean tables 🔬 Deep analysis: descriptive statistics, correlation, attribution, trends, hypothesis testing, with supporting data evidence 📈 Visualization: automatically selects optimal chart types—2–4 core charts explained in one sentence 📝 Report writing: conclusion-first, well-structured analysis reports in Chinese, with actionable recommendations 👥 Use cases: business data analysis, operational reviews, financial reports, user behavior research, academic data exploration—any scenario where you need to turn tables into insights. 💡 Default output is Markdown reports, convertible to Word/PPT. Report style automatically adjusts based on the reader's role (manager/colleague/yourself).
AI Problem Decomposer
# AI Problem Decomposer **One complex question, one clear analysis diagram.** Why is store traffic unchanged while profits keep falling? Why did video views suddenly drop? Why are projects always delayed? Enter the question you want to understand, and AI will break down possible causes, map out cause-and-effect relationships, determine what to investigate first, and generate a clear, easy-to-understand Chinese-language analysis diagram. It does more than tell you **what the possible causes might be**. More importantly, it tells you: **why they might be happening and what to check next.** ## What you'll get **① Intelligent problem breakdown** Identify the key parts of a problem. For situations that can be analyzed with formulas, the tool prioritizes establishing metric relationships to help identify what needs to be investigated. **② 4–6 possible causes** Each cause includes: - Possible symptoms - The cause-and-effect mechanism behind the outcome - A practical way to verify it Unverified speculation is not presented as fact. **③ Intelligent investigation order** Based on impact, verification difficulty, and the information available, the tool recommends what to check first and what to check later, helping you avoid investigating blindly. **④ One professional Chinese-language analysis diagram** The tool automatically selects a suitable structure based on the question, such as a radial map, causal chain, fishbone diagram, or timeline. Different colors distinguish information types, and specific action prompts are placed next to causes, such as: - Check: impression click-through rate - Check: product gross margin - Review: customer comments and feedback **⑤ Image text check** After generation, the tool checks the Chinese text, number of causes, and consistency between the diagram and its content. If obvious text errors are found, it attempts one automatic correction based on the run settings; additional generation may use more credits. ## What kinds of questions is it suited for? **Business operations** - Why are profits falling even though store traffic is unchanged? - Why are returning customers decreasing despite good reviews? **Content creation** - Why did YouTube views suddenly drop? - Why are impressions high but click-through rates low? **Work and learning** - Why are projects always delayed? - Why hasn't performance improved significantly despite investing more time in learning? ## How to use it 1. Enter a specific question you want to analyze. 2. Include any data, screenshots, or reference materials you have. 3. AI breaks down the causes, analyzes the mechanisms, and provides verification methods. 4. Generate a Chinese-language multifactor analysis diagram to help you investigate each item step by step. ## Usage tips - The more specific the question and the more complete the data, the more targeted the analysis will be. - Do not fabricate statistics, survey results, or external sources. - The causes shown in the diagram are analytical hypotheses and do not mean the actual causes have been confirmed. - Generated images may contain layout or text errors. - A single test run uses approximately 100–200 credits. Actual credit usage depends on the model, task complexity, and whether additional generation is needed. **Make complex questions easier to understand, investigate, and act on.**
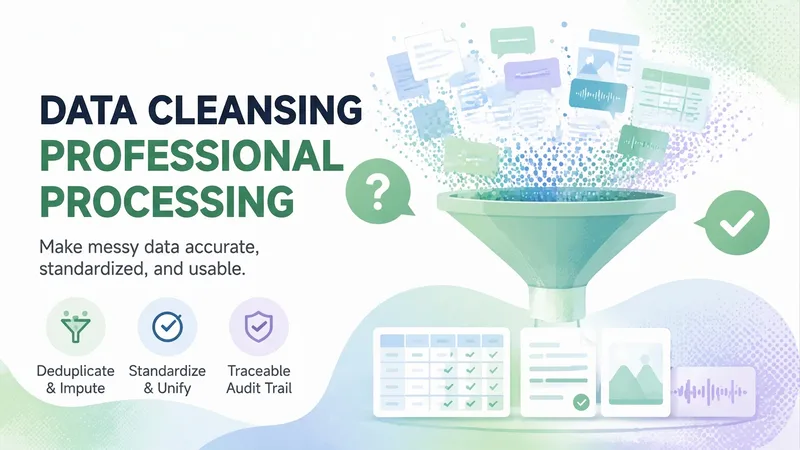
Data Cleaning & Prep Expert
Data cleaning and organization skill for structured tables and unstructured text, images, and audio. Use when you need to clean data, fix messy spreadsheets, remove duplicates, fill missing values, standardize formats, flatten multi-level headers or cross-tabulations, merge sheets, process survey exports, organize ledgers, run data quality health checks, resolve pivot table mismatches, fix zero sums or numbers stored as text, handle mixed full-width/half-width characters, fix GBK encoding errors, convert wide-to-long tables, split multi-select columns, handle merged cells, reconcile mismatched keys, unify field definitions, standardize tables, or write cleaning steps and formulas. Also covers unstructured scenarios such as cleaning chat logs or interview transcripts, deduplicating and desensitizing text, removing phone numbers and ID cards from materials, checking image libraries, finding duplicate photos, cleaning EXIF privacy and location data, organizing recordings, and auditing audio archives. Covers the full workflow of structural diagnosis, tidy reconstruction, cleaning decisions and execution, conservation verification, and audit trail delivery for Excel, CSV, and TSV files (delivering a clean sheet, backup, log, and exclusion details). For unstructured data, delivers health reports and decision lists, while text workflows execute deduplication and desensitization with dual conservation checks for row and character counts. Ideal for Chinese practical scenarios in government, industrial parks, enterprise ledgers, survey exports, business reports, chat or transcription corpora, and image/audio asset libraries. Not suitable for machine learning feature engineering (missing value imputation serves analysis rather than modeling), and does not perform audio transcription or noise reduction.
Information
- Version
- v5
- Last updated
- Runtime credits
- Usage-based
- Models
- Auto
- Use cases
- Presentations & reportingResearch & analysisBusiness & strategy
- What you get
- ReportDocumentPlan