
Stock Report Analyzer
Input a stock code; AI simplifies the report.
Stock Report Analyzer
Input a stock code; AI simplifies the report.
Description
Financial reports are a listed company's "physical exam report", but most investors feel lost when faced with pages of dense numbers: • 📝 Can't read the three financial statements — What do the balance sheet, income statement, and cash flow statement tell you? Which numbers matter most? • 🤔 Don't know what to look at — With dozens of pages, which key metrics should you focus on? • 📊 Lack an analysis framework — Even when you find the data, how do you judge good from bad and cross-check it? • 🏭 Industry standards differ — What counts as "good" varies completely by industry; manufacturing and internet companies can't be measured with the same yardstick. • ⏰ Time cost is too high — Manually looking up data, comparing peers, and calculating growth rates can take hours for one report. This skill was built to solve exactly these problems. It automates a professional financial analyst's framework, so you just need to enter a stock code to get a structured, logical, and beginner-friendly financial report interpretation. The tool's core value lies in its rigorous analysis framework, covering multiple dimensions from assessing growth quality to analyzing business models. It not only compares core metrics like revenue, gross margin, net margin, and cash flow, but also runs a quick Q&A on the seven key financial questions investors care about most. It clearly shows whether profits are turning into real cash, and whether receivables and inventory carry potential risks. By benchmarking against industry leaders, it helps you identify a company's true position in its industry chain. When generating the report, it also evaluates valuation levels, core strengths, and potential risks, and offers data-driven recommendations on what to watch. All analysis is presented in intuitive tables and plain, easy-to-understand language, turning complex accounting terms into concrete investment logic. Whether for daily review or deep research, it helps you quickly zero in on the core issue amid massive amounts of data, improving the efficiency and accuracy of your investment decisions.
Showcase
1 / 4
Related Skills
View all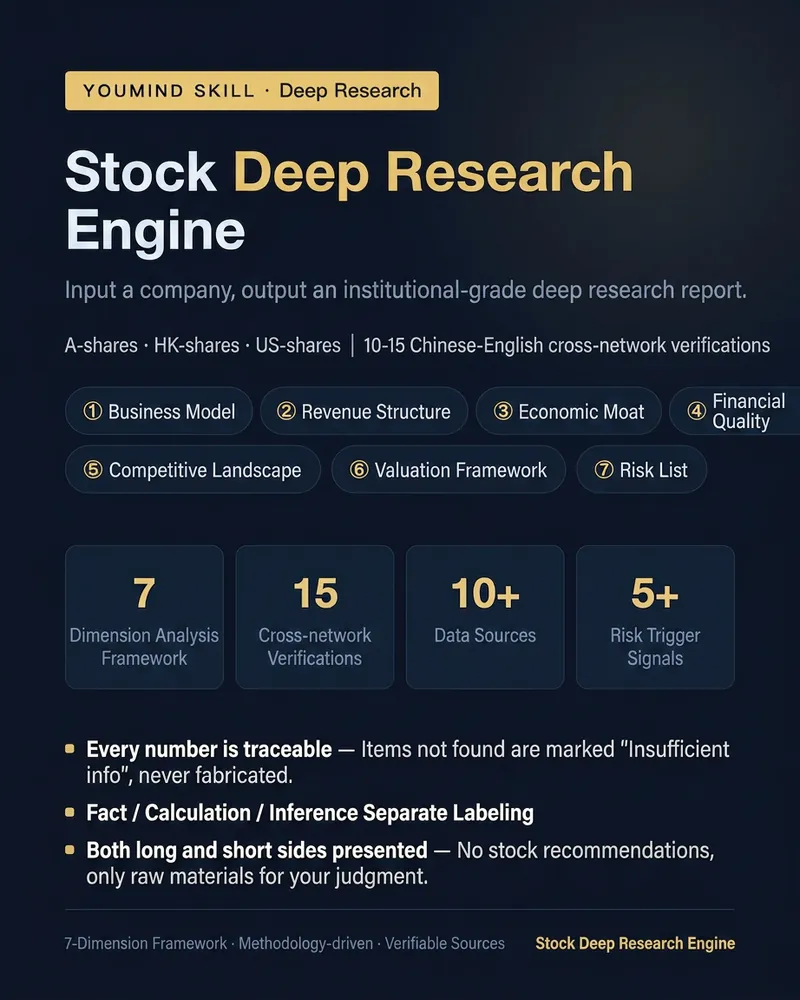
Deep Stock Research Engine
Not a news summary, but an individual stock research report with a methodological framework. Enter a company (A-share/H-share/US stock name or code), and it will perform 10-15 bilingual web searches to produce a report based on a seven-dimension framework: ① Business Model – where money comes from and goes, with a "translated into plain language" version ② Revenue Structure – breakdown by business, growth engines and drags ③ Moat – mandatory answer on widening or narrowing, using market share, gross margin, and pricing power ④ Financial Quality – cash flow vs profit alignment, changes in receivables, inventory, and goodwill ⑤ Competitive Landscape – competitor comparison table and concentration direction ⑥ Valuation Framework – only data and calculation framework, no judgment of over/undervaluation ⑦ Risk List – sorted by impact, each with verifiable trigger signals Each report includes: a one-page bull/bear summary (with substantial evidence on both sides), a next-quarter tracking list, and data sources for each point. Three iron rules: · Each key number is traceable to official filings or authoritative media; if not found, labeled 'insufficient information', never fabricated · Facts, calculations, and inferences are labeled separately · No stock price predictions, no target prices, no buy/sell advice – even for 'should I buy', only bull/bear evidence is given Supports three perspectives: Understand the Business (default), Financial Checkup, and Company Comparison. Suitable for investment researchers, financial content creators, and serious investors who want to systematically understand a company.
Report Anomaly Graphic
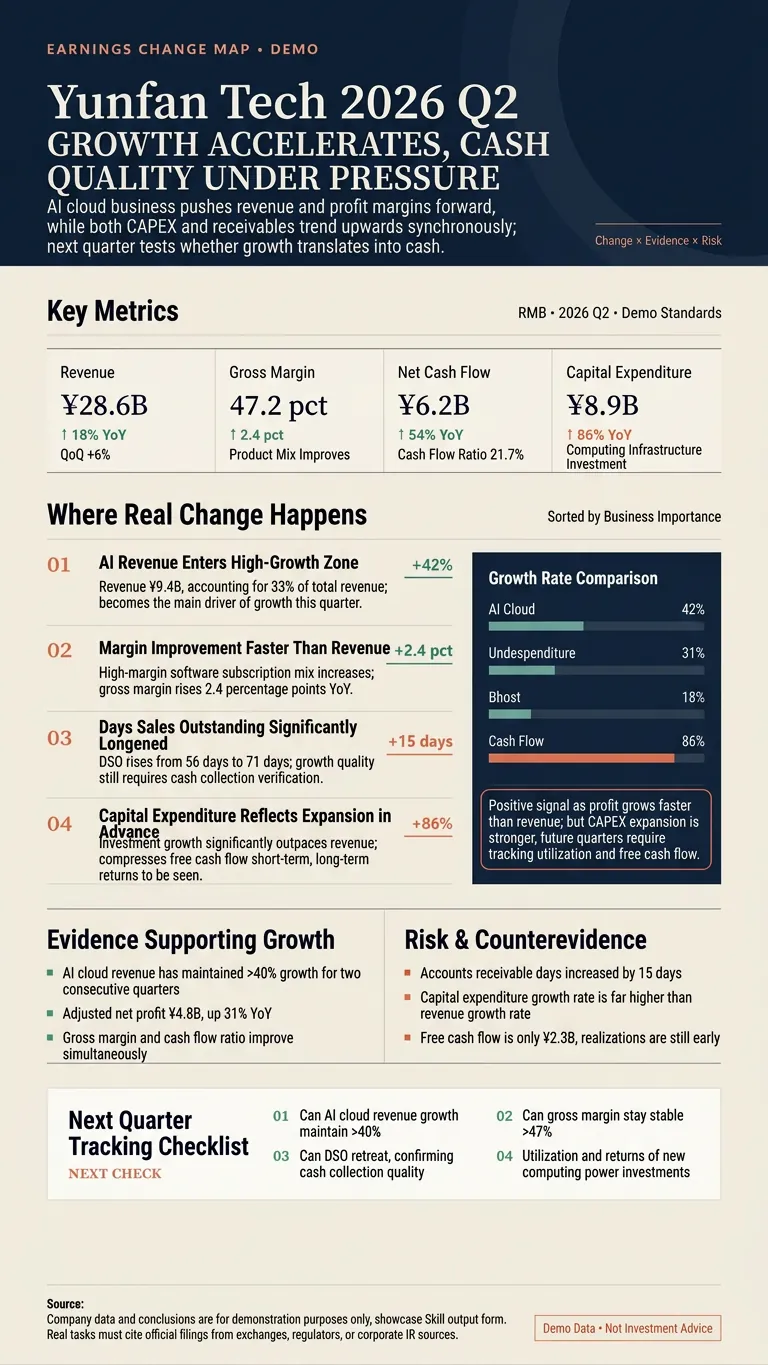
Not a financial report rehash, but identifying where things really changed. Enter the name, ticker, report link, or PDF of an A-share, Hong Kong, or US-listed company. The tool automatically cross-checks official filings, compares key metrics on a like-for-like basis, and identifies growth accelerations or decelerations, margin shifts, cash flow anomalies, one-time items, and changes in management guidance. Each delivery includes: ① Source cards and key metrics table ② The most important report anomalies ③ Supporting evidence and risk checklist ④ Tracking indicators for the next quarter ⑤ A 3:5 or 9:16 investor long graphic ⑥ A ready-to-post short summary You can use it to: • Analyze Tencent's latest report, focusing on gaming, advertising, and capital expenditure • Compare NVIDIA's last two quarters to find accelerating or decelerating metrics • Check Kweichow Moutai's cash flow, contract liabilities, and channel inventory • Verify numbers and conclusions in a stock analysis article, then compile into a graphic All numbers must be traceable to original sources: company announcements, exchange filings, SEC, or company IR. Facts, calculations, and inferences are labelled separately. No fabricated missing data. No buy or sell recommendations. Ideal for investors, financial content creators, researchers, and corporate content teams.
Stock Valuation Analysis
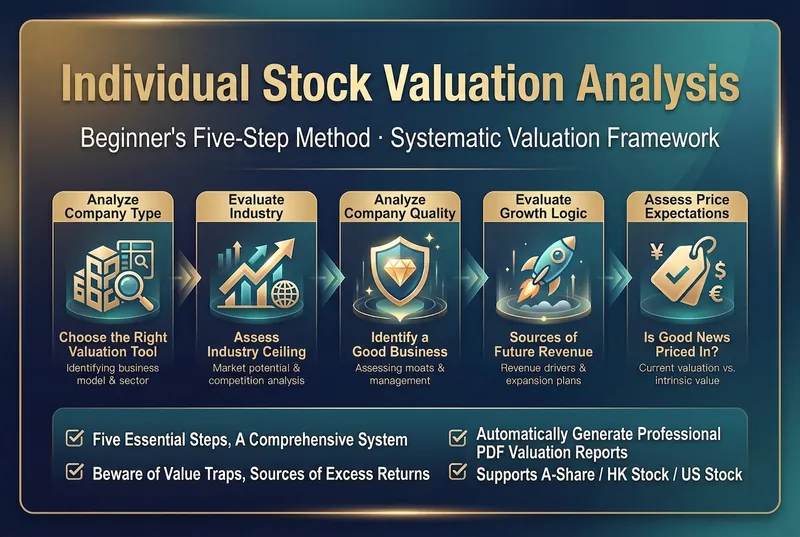
The two biggest fears in stock investing are buying a bad company and overpaying for a good one. Many investors, when they get a stock, first check its PE and PB ratios, compare them with peers, and draw conclusions—this is the biggest misconception in valuation. • 📝 Focusing only on numbers, not the company: Is a low PE always cheap? A low PE for a cyclical stock at the peak of its cycle can actually be a trap; for a growth stock, a high PE isn't necessarily expensive. With the wrong yardstick, you can't measure correctly. • 🤔 Discussing valuation without considering the industry: A contract manufacturer and a tech platform may both have a PE of 20, but their meanings are vastly different. Without first understanding the industry ceiling and business model, any valuation number is a castle in the air. • 📉 Ignoring value traps: A low valuation could be a sign of fundamental deterioration, not an investment opportunity. If the company quality is poor, no matter how 'cheap' it looks, it could still be a trap. • 🎯 Overlooking expectation gaps: Stock price movements don't depend on the absolute level of performance, but on the relative difference between performance and market expectations. If profits rise 30% but the market expected 50%, the stock can still fall. • 📊 Being too precise in valuation can itself be a mistake: Valuation is a range, not an exact number. Better to be roughly right than precisely wrong. This skill is designed to solve these problems. It is based on the 'Five-Step Valuation Method' framework and uses a systematic five-step process that cannot be skipped. It guides you from company type, industry ceiling, company quality, growth logic, and price expectations, progressing step by step to complete a full, professional individual stock valuation analysis. Finally, it outputs a structured valuation report and a downloadable PDF file. It applies to A-shares, Hong Kong stocks, and U.S. stocks.
Information
- Last updated
- Runtime credits
- Usage-based
- Models
- Auto