
Text to 3D Infographic
Convert text into readable 3D infographics
Text to 3D Infographic
Convert text into readable 3D infographics
Showcase
Description
Transform a single sentence, paragraph, or abstract concept into clear, readable 3D infographics, perfect for presentations, article illustrations, study notes, lectures, and technical explanations. It extracts core points from the text, presenting them with concise labels and brief explanations on 3D nodes, cards, or floating panels. This preserves the original meaning while avoiding dense text blocks, making complex content easier to quickly understand and remember. Based on parallel, progressive, cyclical, hierarchical, comparative, causal, or chronological relationships in the content, it matches appropriate 3D graphic structures such as flowcharts, timelines, layered structures, radial layouts, or comparison layouts. It also selects suitable materials, color schemes, lighting, and visual styles tailored for business, tech, or educational scenarios. Text within the image is placed on front-facing planar surfaces to emphasize clarity and the alignment between graphics and text, supporting common image ratios like 16:9, 4:3, 1:1, and 3:2, as well as matching the language of the input. After generating the image, it provides the graphic structure, 3D style and lighting strategy, a text list of the image contents, content coverage details, and the actual aspect ratio used. This makes it easy for you to verify information completeness and directly apply the output to business presentations, popular science explanations, process walkthroughs, or daily content organization.
Best for
Ideal for anyone who needs to create presentation visuals, course diagrams, or study notes.
How to use this Skill
Provide your input
Provide a sentence, paragraph, or abstract concept, and optionally specify an image aspect ratio.
Run the Skill
The tool extracts core points, matches information relationships with 3D graphic structures, and generates a 3D infographic with concise text labels.
Review your result
Receive a 3D infographic along with a brief summary detailing the graphic structure, visual strategy, text list, content coverage, and aspect ratio.
Related Skills
View allMinimal Explainer Diagram
Turn selected text, articles, files, or project information into a clear, compact explainer diagram. It extracts key nodes and relationships to help you organize processes, hierarchies, comparisons, timelines, or connections between different approaches. It’s suited to project presentations, team communication, content summaries, and organizing ideas. You can specify the diagram type, focus, layout direction, or accent color. Or simply provide the material, and it will determine a suitable way to present the content. It supports flowcharts, structure diagrams, comparison diagrams, timelines, and solution relationship diagrams. Before drawing, it lets you confirm the diagram type, layout, and colors to help prevent misunderstandings about the information’s focus. The finished diagram uses a white background, generous whitespace, fine lines, and flat geometric shapes, with a single low-saturation accent color. Short node labels and clear connecting lines show the relationships. It doesn’t crowd the original text or add people and decorative illustrations, so readers can quickly understand the content structure without first reading lengthy explanations.
Professional Infographic Maker
Quickly transform complex information, data, and ideas into clear, professional, publication-ready infographics. Simply describe your topic, content, and purpose to generate visual outputs suitable for reports, marketing materials, presentations, internal documents, and social media without requiring any design experience. It supports common formats such as data visualizations, timelines, flowcharts, comparison charts, list summaries, geographic distributions, hierarchical structures, resumes, and social media graphics. It also matches visual styles to scenarios like enterprise, healthcare, technology, education, finance, and environmental protection. You can choose color schemes tailored to different audiences, including accessible palettes that are easier to read and considerate of color vision deficiencies. For content like market trends, industry statistics, scientific and medical information, or recent events, it can combine real-time research to supplement facts, figures, and background, helping reduce outdated or unsupported information. The generated results undergo quality checks focusing on layout hierarchy, text readability, data expression, color contrast, and overall communication effectiveness, with necessary optimizations for the use case. It is ideal for creating business report charts, product comparisons, project milestones, how-to guides, and social media content.
 Image
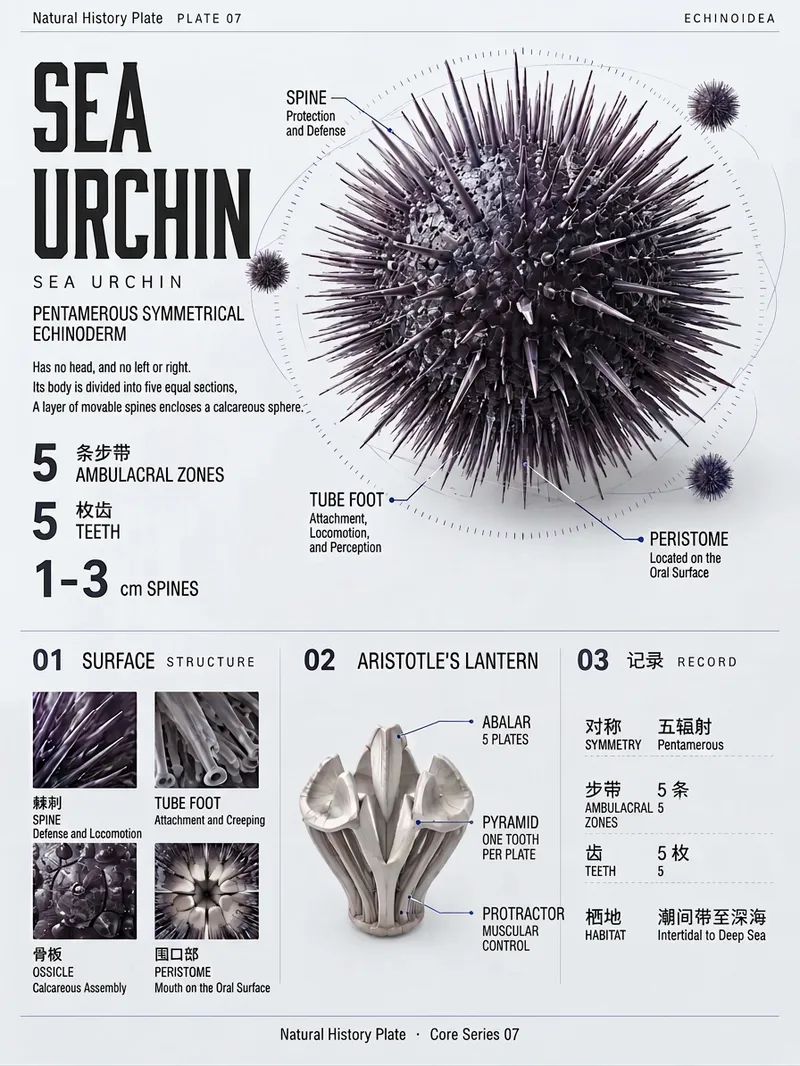
Spherical Core Infographic
Transform any species, material, artifact, product, celestial body, or natural phenomenon into a distinctive and information-dense spherical core 3D infographic. You can provide a subject name, image, text, or link. Even with incomplete material, it extracts a clear subject and chooses sensible cross-sections, aggregates, or cutaways for elongated or flat objects that do not naturally fit a sphere. The final image features an off-center 3D core as the main visual, combined with homotypic protrusions, small-scale reference figures, contour-fitting geometric wireframes, and orbit scales to present surface structures, mechanisms, and data records. A cool grayish-white neutral background paired with a single accent color makes it suitable for science posters, product displays, exhibition visuals, and knowledge illustrations. Chinese titles, English subtitles, numerical info, and detail labels are seamlessly integrated into the graphic while balancing hierarchy, whitespace, and readability. The output includes a vertical infographic, plus a brief explanation of subject selection, accent color, spherical core composition, section layout, text volume, and replaceable themes. It emphasizes verifiable facts and self-consistent data representation while avoiding unfounded exaggerations. Once finished, it verifies subject recognizability, layout proportions, text completeness, and visual consistency.
Information
- Version
- v7
- Last updated
- Runtime credits
- Usage-based
- Models
- GPT Image 2
- Use cases
- Images & designPresentations & reportingLearning & education
- What you get
- ImageBrief
- Visual styles
- 3D