Understand Companies Fast
Deep stock research with Munger’s models
Description
Recommended by
淡苍
Why we love this skill
Applies a buyer-side research standard, tracing history, governance, business model, 10-year financials, and moats to valuation with sourced evidence, scenario analysis, decision rules, blind spots, and ongoing tracking.
Enter a company name or stock ticker for an in-depth investment analysis using Charlie Munger’s latticework of mental models and a value-investing perspective. First, trace the company’s history, ownership, and governance. Then examine a 10-year financial overview and break down each business, product, and subsidiary to identify key turning points. Quantify each competitive moat and show how it translates into valuation. The analysis requires searching before reaching conclusions, cross-checking information across two sources, and labeling definitions and sources. It delivers three-scenario valuation and a 2×2 quality-versus-price decision framework, along with an actionable “Deep Value Investing Analysis” report that includes a list of questions for ongoing monitoring.
Related Skills
View all
Deep Stock Research Engine
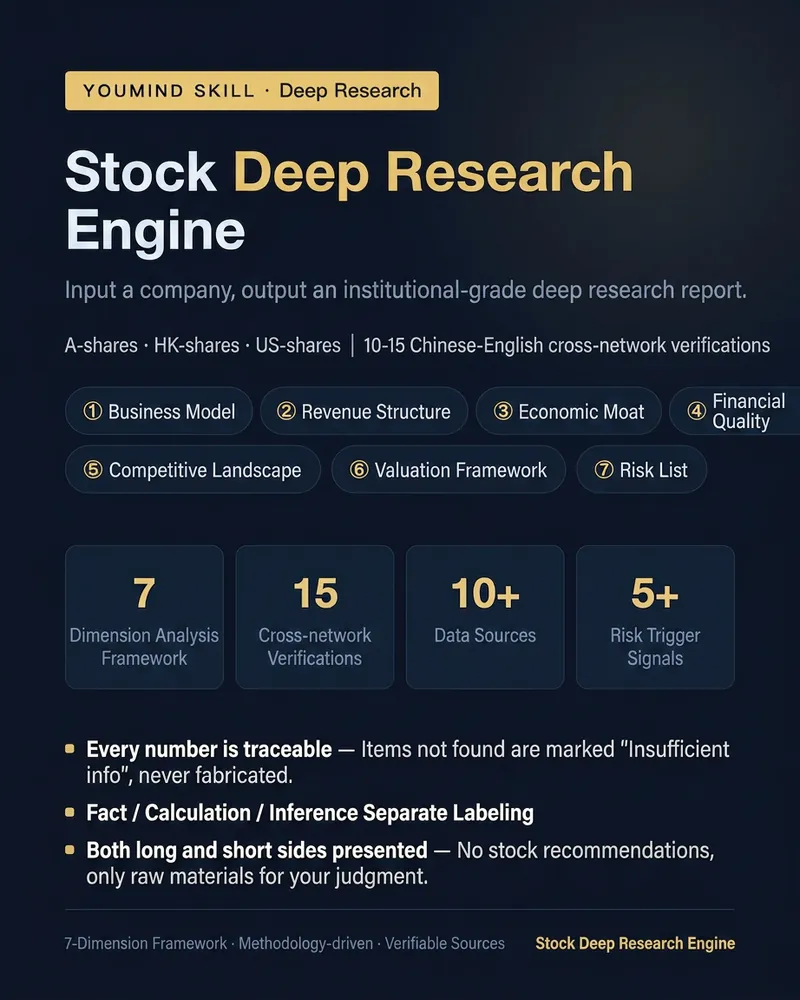
Not a news summary, but an individual stock research report with a methodological framework. Enter a company (A-share/H-share/US stock name or code), and it will perform 10-15 bilingual web searches to produce a report based on a seven-dimension framework: ① Business Model – where money comes from and goes, with a "translated into plain language" version ② Revenue Structure – breakdown by business, growth engines and drags ③ Moat – mandatory answer on widening or narrowing, using market share, gross margin, and pricing power ④ Financial Quality – cash flow vs profit alignment, changes in receivables, inventory, and goodwill ⑤ Competitive Landscape – competitor comparison table and concentration direction ⑥ Valuation Framework – only data and calculation framework, no judgment of over/undervaluation ⑦ Risk List – sorted by impact, each with verifiable trigger signals Each report includes: a one-page bull/bear summary (with substantial evidence on both sides), a next-quarter tracking list, and data sources for each point. Three iron rules: · Each key number is traceable to official filings or authoritative media; if not found, labeled 'insufficient information', never fabricated · Facts, calculations, and inferences are labeled separately · No stock price predictions, no target prices, no buy/sell advice – even for 'should I buy', only bull/bear evidence is given Supports three perspectives: Understand the Business (default), Financial Checkup, and Company Comparison. Suitable for investment researchers, financial content creators, and serious investors who want to systematically understand a company.
ResearchRapid Industry Understanding
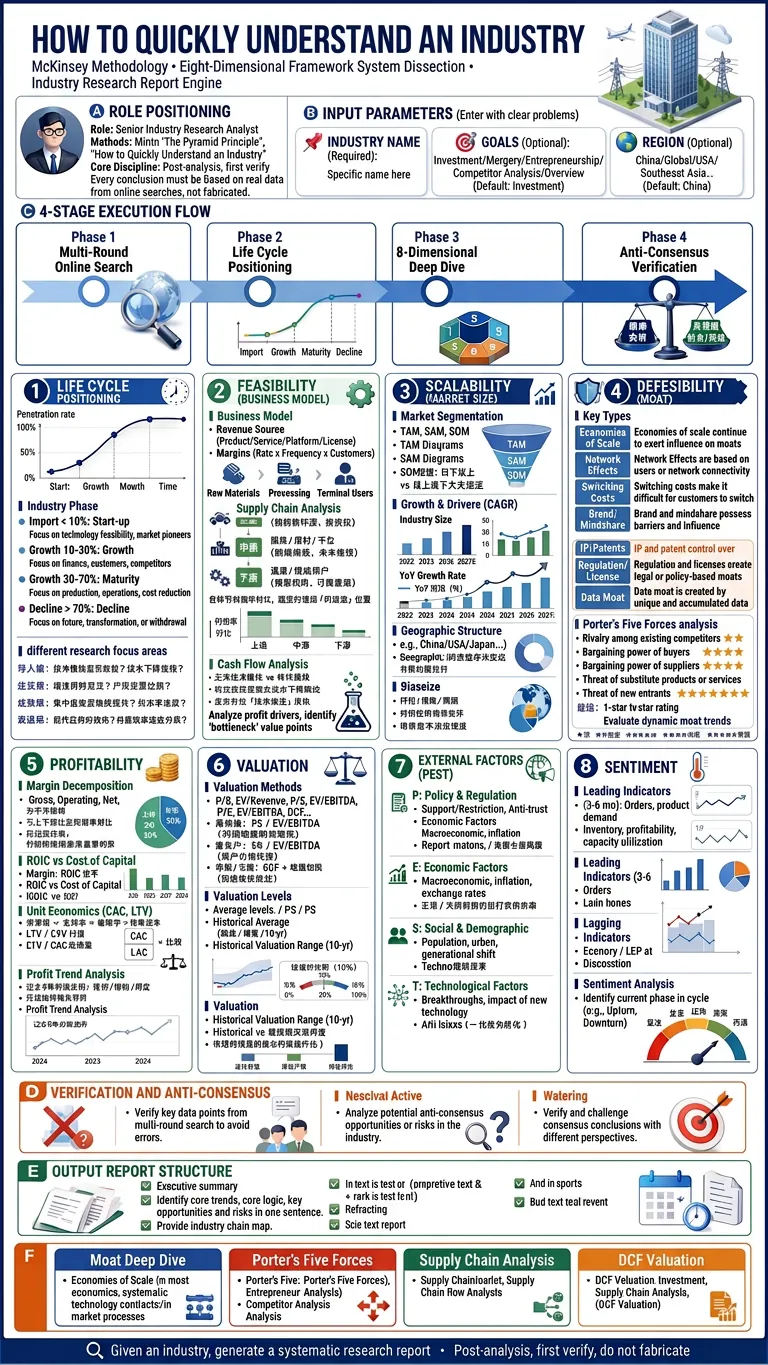
📋 Usage Guide This Skill is an industry research engine based on McKinsey methodology, using the eight-dimension framework from Xiao Jing's "How to Quickly Understand an Industry". Tell it an industry name, and it produces a systematic research report. —————————————————————————————— 🚀 Basic Usage Just tell me the industry you want to research—the more specific, the better: a. "Analyze the solid-state battery industry" b. "Look at the humanoid robot supply chain from an entrepreneurial perspective" c. "Is the solar industry still investable now?" You can optionally provide three details (if missing, I'll use defaults): 1. Industry name: be specific, e.g., "perovskite solar" instead of "new energy"—required; 2. Goal: investment / career / entrepreneurship / competitive analysis / education, default: investment; 3. Region: China market / global / US / Southeast Asia..., default: China market; —————————————————————————————— ⚙️ What it does automatically? The entire process has 4 stages: 1. Multi-round web searches for market size/growth/penetration rate, supply chain, competitive landscape, moat evidence, policy, valuation—every conclusion has a source and timestamp, never fabricated; 2. Lifecycle positioning: use penetration rate to determine if the industry is in introduction/growth/maturity/decline—different stages have completely different research focuses; 3. Eight-dimension deep dive: business model → market size → moat (forced deep dive into dynamic trends) → competitive landscape (forced scoring on each of Porter's Five Forces) → valuation → PEST → business cycle; 4. Contrarian check: distinguish market priced-in consensus from overlooked real issues, and provide decision recommendations; —————————————————————————————— 📊 What it outputs? A professional research report in Markdown format, structured as: 1. ⚡ 30-second verdict — stage / core profit logic / biggest opportunity / biggest risk / one-sentence conclusion; 2. Research object and boundary definition; 3. Lifecycle positioning (with penetration rate data); 4. Eight-dimension analysis (moat includes dynamic trend table, Porter's Five Forces scoring table); 5. Contrarian check; 6. Conclusion and decision recommendations; 7. Key risk list; 8. Data sources and time notes; —————————————————————————————— 🔑 Two Core Highlights 1. Forced deep dive on moat: not just the type of barrier, but must answer "has it widened or narrowed in the past 2-3 years?" using market share/gross margin/pricing power data; 2. Porter's Five Forces scored individually: all five forces scored to avoid shortcuts, determining who has the strongest bargaining power now and whether the landscape is favorable or deteriorating for leaders; —————————————————————————————— ⏱️ Time Approximately 2-4 minutes, due to multiple rounds of search + dimension-by-dimension analysis + report writing —————————————————————————————— 🧩 Subsequent Extensions After the report is generated, you can continue with two specialized analyses (requires manual confirmation, won't run automatically): 1. "Unchain to find bottlenecks": identify physical bottlenecks in the supply chain that can't be bypassed when trends scale, locking in true beneficiary targets; 2. "DCF valuation": run a full discounted cash flow model for a specific company within the industry; —————————————————————————————— ▶️ Want to try? Just tell me an industry name, e.g., "Take a look at the AI agent industry from an entrepreneurial perspective" or "What's the situation with the hydrogen energy supply chain?"
Stock Valuation Analysis
The two biggest fears in stock investing are buying a bad company and overpaying for a good one. Many investors, when they get a stock, first check its PE and PB ratios, compare them with peers, and draw conclusions—this is the biggest misconception in valuation. • 📝 Focusing only on numbers, not the company: Is a low PE always cheap? A low PE for a cyclical stock at the peak of its cycle can actually be a trap; for a growth stock, a high PE isn't necessarily expensive. With the wrong yardstick, you can't measure correctly. • 🤔 Discussing valuation without considering the industry: A contract manufacturer and a tech platform may both have a PE of 20, but their meanings are vastly different. Without first understanding the industry ceiling and business model, any valuation number is a castle in the air. • 📉 Ignoring value traps: A low valuation could be a sign of fundamental deterioration, not an investment opportunity. If the company quality is poor, no matter how 'cheap' it looks, it could still be a trap. • 🎯 Overlooking expectation gaps: Stock price movements don't depend on the absolute level of performance, but on the relative difference between performance and market expectations. If profits rise 30% but the market expected 50%, the stock can still fall. • 📊 Being too precise in valuation can itself be a mistake: Valuation is a range, not an exact number. Better to be roughly right than precisely wrong. This skill is designed to solve these problems. It is based on the 'Five-Step Valuation Method' framework and uses a systematic five-step process that cannot be skipped. It guides you from company type, industry ceiling, company quality, growth logic, and price expectations, progressing step by step to complete a full, professional individual stock valuation analysis. Finally, it outputs a structured valuation report and a downloadable PDF file. It applies to A-shares, Hong Kong stocks, and U.S. stocks.
Understand Companies Fast
Deep stock research with Munger’s models
Description
Recommended by
淡苍
Why we love this skill
Applies a buyer-side research standard, tracing history, governance, business model, 10-year financials, and moats to valuation with sourced evidence, scenario analysis, decision rules, blind spots, and ongoing tracking.
Enter a company name or stock ticker for an in-depth investment analysis using Charlie Munger’s latticework of mental models and a value-investing perspective. First, trace the company’s history, ownership, and governance. Then examine a 10-year financial overview and break down each business, product, and subsidiary to identify key turning points. Quantify each competitive moat and show how it translates into valuation. The analysis requires searching before reaching conclusions, cross-checking information across two sources, and labeling definitions and sources. It delivers three-scenario valuation and a 2×2 quality-versus-price decision framework, along with an actionable “Deep Value Investing Analysis” report that includes a list of questions for ongoing monitoring.
Related Skills
View all
Deep Stock Research Engine
Not a news summary, but an individual stock research report with a methodological framework. Enter a company (A-share/H-share/US stock name or code), and it will perform 10-15 bilingual web searches to produce a report based on a seven-dimension framework: ① Business Model – where money comes from and goes, with a "translated into plain language" version ② Revenue Structure – breakdown by business, growth engines and drags ③ Moat – mandatory answer on widening or narrowing, using market share, gross margin, and pricing power ④ Financial Quality – cash flow vs profit alignment, changes in receivables, inventory, and goodwill ⑤ Competitive Landscape – competitor comparison table and concentration direction ⑥ Valuation Framework – only data and calculation framework, no judgment of over/undervaluation ⑦ Risk List – sorted by impact, each with verifiable trigger signals Each report includes: a one-page bull/bear summary (with substantial evidence on both sides), a next-quarter tracking list, and data sources for each point. Three iron rules: · Each key number is traceable to official filings or authoritative media; if not found, labeled 'insufficient information', never fabricated · Facts, calculations, and inferences are labeled separately · No stock price predictions, no target prices, no buy/sell advice – even for 'should I buy', only bull/bear evidence is given Supports three perspectives: Understand the Business (default), Financial Checkup, and Company Comparison. Suitable for investment researchers, financial content creators, and serious investors who want to systematically understand a company.
ResearchRapid Industry Understanding
📋 Usage Guide This Skill is an industry research engine based on McKinsey methodology, using the eight-dimension framework from Xiao Jing's "How to Quickly Understand an Industry". Tell it an industry name, and it produces a systematic research report. —————————————————————————————— 🚀 Basic Usage Just tell me the industry you want to research—the more specific, the better: a. "Analyze the solid-state battery industry" b. "Look at the humanoid robot supply chain from an entrepreneurial perspective" c. "Is the solar industry still investable now?" You can optionally provide three details (if missing, I'll use defaults): 1. Industry name: be specific, e.g., "perovskite solar" instead of "new energy"—required; 2. Goal: investment / career / entrepreneurship / competitive analysis / education, default: investment; 3. Region: China market / global / US / Southeast Asia..., default: China market; —————————————————————————————— ⚙️ What it does automatically? The entire process has 4 stages: 1. Multi-round web searches for market size/growth/penetration rate, supply chain, competitive landscape, moat evidence, policy, valuation—every conclusion has a source and timestamp, never fabricated; 2. Lifecycle positioning: use penetration rate to determine if the industry is in introduction/growth/maturity/decline—different stages have completely different research focuses; 3. Eight-dimension deep dive: business model → market size → moat (forced deep dive into dynamic trends) → competitive landscape (forced scoring on each of Porter's Five Forces) → valuation → PEST → business cycle; 4. Contrarian check: distinguish market priced-in consensus from overlooked real issues, and provide decision recommendations; —————————————————————————————— 📊 What it outputs? A professional research report in Markdown format, structured as: 1. ⚡ 30-second verdict — stage / core profit logic / biggest opportunity / biggest risk / one-sentence conclusion; 2. Research object and boundary definition; 3. Lifecycle positioning (with penetration rate data); 4. Eight-dimension analysis (moat includes dynamic trend table, Porter's Five Forces scoring table); 5. Contrarian check; 6. Conclusion and decision recommendations; 7. Key risk list; 8. Data sources and time notes; —————————————————————————————— 🔑 Two Core Highlights 1. Forced deep dive on moat: not just the type of barrier, but must answer "has it widened or narrowed in the past 2-3 years?" using market share/gross margin/pricing power data; 2. Porter's Five Forces scored individually: all five forces scored to avoid shortcuts, determining who has the strongest bargaining power now and whether the landscape is favorable or deteriorating for leaders; —————————————————————————————— ⏱️ Time Approximately 2-4 minutes, due to multiple rounds of search + dimension-by-dimension analysis + report writing —————————————————————————————— 🧩 Subsequent Extensions After the report is generated, you can continue with two specialized analyses (requires manual confirmation, won't run automatically): 1. "Unchain to find bottlenecks": identify physical bottlenecks in the supply chain that can't be bypassed when trends scale, locking in true beneficiary targets; 2. "DCF valuation": run a full discounted cash flow model for a specific company within the industry; —————————————————————————————— ▶️ Want to try? Just tell me an industry name, e.g., "Take a look at the AI agent industry from an entrepreneurial perspective" or "What's the situation with the hydrogen energy supply chain?"

Stock Valuation Analysis
The two biggest fears in stock investing are buying a bad company and overpaying for a good one. Many investors, when they get a stock, first check its PE and PB ratios, compare them with peers, and draw conclusions—this is the biggest misconception in valuation. • 📝 Focusing only on numbers, not the company: Is a low PE always cheap? A low PE for a cyclical stock at the peak of its cycle can actually be a trap; for a growth stock, a high PE isn't necessarily expensive. With the wrong yardstick, you can't measure correctly. • 🤔 Discussing valuation without considering the industry: A contract manufacturer and a tech platform may both have a PE of 20, but their meanings are vastly different. Without first understanding the industry ceiling and business model, any valuation number is a castle in the air. • 📉 Ignoring value traps: A low valuation could be a sign of fundamental deterioration, not an investment opportunity. If the company quality is poor, no matter how 'cheap' it looks, it could still be a trap. • 🎯 Overlooking expectation gaps: Stock price movements don't depend on the absolute level of performance, but on the relative difference between performance and market expectations. If profits rise 30% but the market expected 50%, the stock can still fall. • 📊 Being too precise in valuation can itself be a mistake: Valuation is a range, not an exact number. Better to be roughly right than precisely wrong. This skill is designed to solve these problems. It is based on the 'Five-Step Valuation Method' framework and uses a systematic five-step process that cannot be skipped. It guides you from company type, industry ceiling, company quality, growth logic, and price expectations, progressing step by step to complete a full, professional individual stock valuation analysis. Finally, it outputs a structured valuation report and a downloadable PDF file. It applies to A-shares, Hong Kong stocks, and U.S. stocks.
Find your next favorite skill
Explore more curated AI skills for research, creation, and everyday work.