Showcase
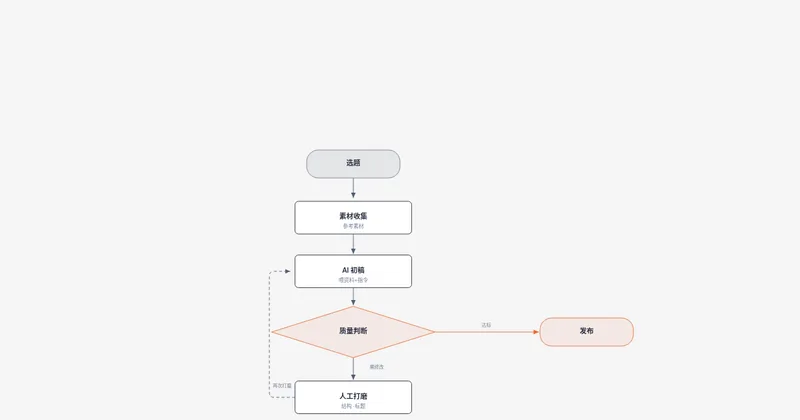
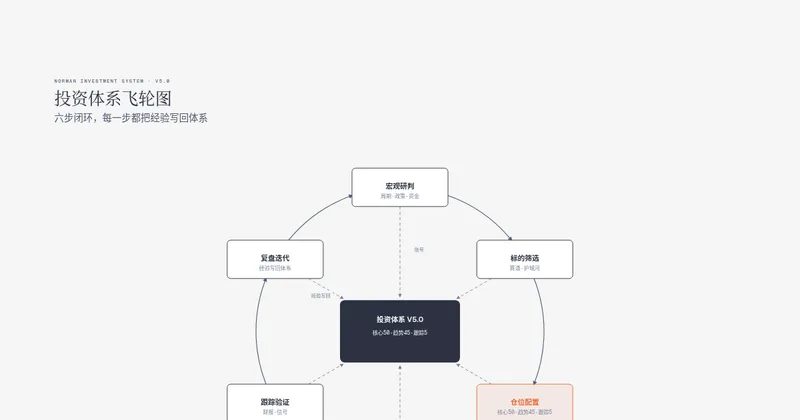
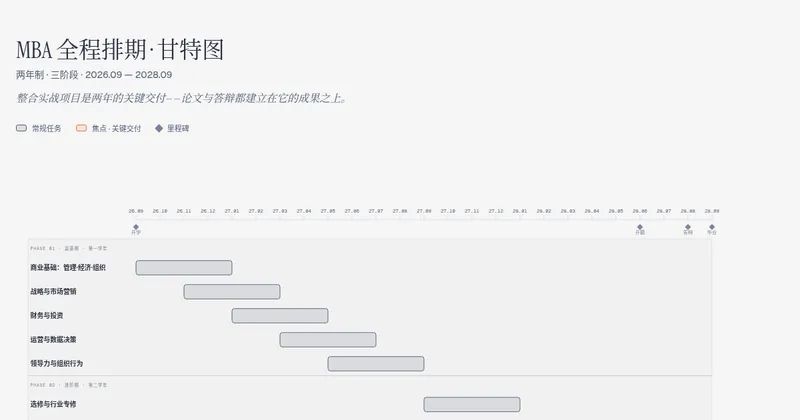
Description
Create branded architecture, IT current-state, flowchart, sequence, state machine, ER/data model, timeline, swimlane, quadrant, radar/spider, polar chart (polar/radial lollipop), loop/flywheel, nested, tree, org chart, layer stack, Venn, pyramid/funnel, treemap, bar, line, Gantt and scatter charts, high-level, process, medallion, data flow, DP integration, DP security matrix, Sankey, fishbone, Wardley map, kanban, user journey, deployment, dependency graph, UML class, story map, or database schema diagrams as standalone HTML/SVG/PNG. Redraw .drawio/.drawio.png/.drawio.svg or Mermaid .mmd sources at a chosen size/detail; onboard brand tokens from a website; add semantic patterns, callouts, accessible motion, or sketchy/hand-drawn styling.
Related Skills
View all
Professional Diagram Design Studio
Transform ideas, text, documents, SOPs, database schemas, and technical specifications into logically validated, visually compelling diagrams across 15 universal diagram families using YouMind's native capabilities. The skill analyzes your information structure first to select the right diagram type—spanning flowcharts, BPMN, swimlanes, system architecture, UML, ERDs, DFDs, mind maps, roadmaps, and strategic matrices—then delivers a rendered diagram, a structured node-and-relationship specification, and a 100-point structural and visual quality audit.
 Webpage
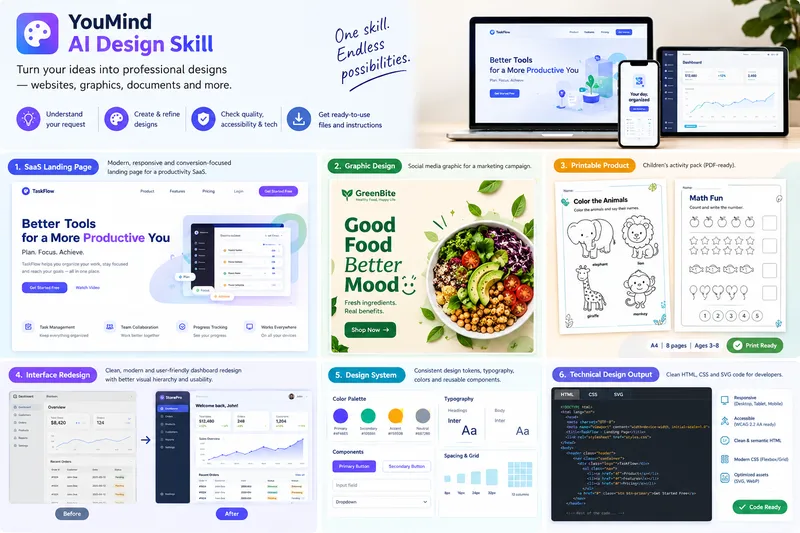
Design-to-Deliverable AI Studio
Turn rough ideas, content outlines, or interface screenshots into polished, implementation-ready design deliverables through a structured 8-phase workflow. ### Who It's For Founders, product managers, marketers, educators, creators, and developers who need accessible visual designs and clean front-end code without trial-and-error prompting. ### What to Provide - Your design goal and audience (SaaS landing page, dashboard, mobile UI, printable worksheet, social graphic, poster, or brand kit). - Any required copy, dimensions, brand colors, or reference screenshots (if omitted, the skill applies sensible defaults and discloses them). ### How It Works 1. **Brief & Strategy**: Extracts your objective and constraints, flags conflicting specs early, and selects a tailored strategy (Conversion, Task-Efficiency, Readability/Print, or Accessibility-First). 2. **Visual System**: Locks in a semantic color palette (with WCAG 2.2 AA contrast math), modular typography scale, and 4px/8px grid. 3. **Production & Smart Fallbacks**: Generates semantic HTML5/CSS3, scalable SVG vectors, print-ready worksheets (`@page` / `@media print`), and W3C design tokens—plus 3 standalone image prompts (Strict Hierarchical, Creative Aesthetic, Hybrid) when raster image tools aren't active. 4. **Honest 4-State QA**: Audits contrast, labels, links, and print geometry, tagging every check as `VERIFIED`, `NOT VERIFIED`, `FAILED`, or `NOT APPLICABLE`. ### What You Get - Concise Design Brief & Visual System Token Table - Implementation-ready HTML/CSS/SVG files or printable layouts - 4-State QA Report with editing and export instructions ### Boundaries Outputs open formats (`.html`, `.css`, `.svg`, `.pdf`, `design-tokens.json`) that import into Figma/Illustrator rather than closed binaries (`.fig`, `.psd`). Commercial CMYK press proofs and legal trademark checks require human review.
 Image
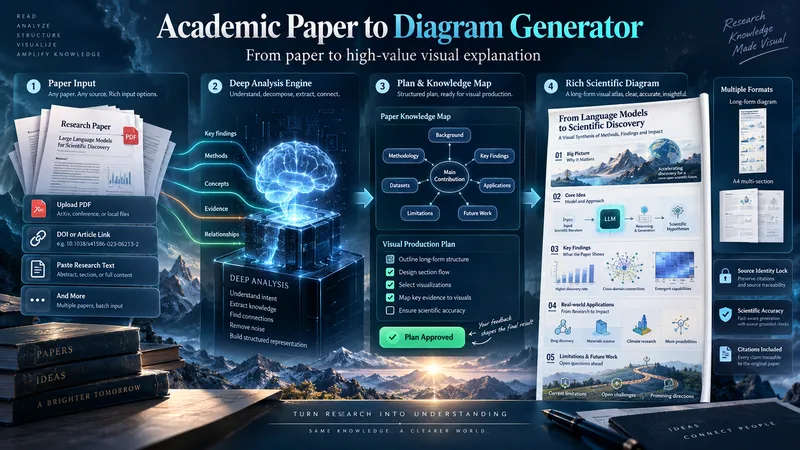
Academic Paper to Diagram Generator
Transform academic papers into detailed, scientifically faithful visual diagrams. The skill deeply analyzes the paper, identifies its most valuable concepts, mechanisms, methods, findings, and relationships, then builds a visual plan with you before generation. Instead of forcing every paper into a small infographic, it can create long vertical diagrams, wide technical maps, multi-section visual explainers, or A4-ready 2–3 part layouts when needed. The visual style is adapted to the subject, with room for AI-driven creativity, scientific illustration, data integration, annotations, and topic-specific visual storytelling. You can start with a PDF, URL, DOI, pasted text, or a request to find a suitable paper. The diagram language is user-approved, the source identity is locked for accuracy, and the final image is generated only after you review the visual plan and production prompt.
Information
- Version
- v4
- Last updated
- Runtime credits
- Usage-based
- Models
- Auto