gb
Minimalist Zine-Style Poster
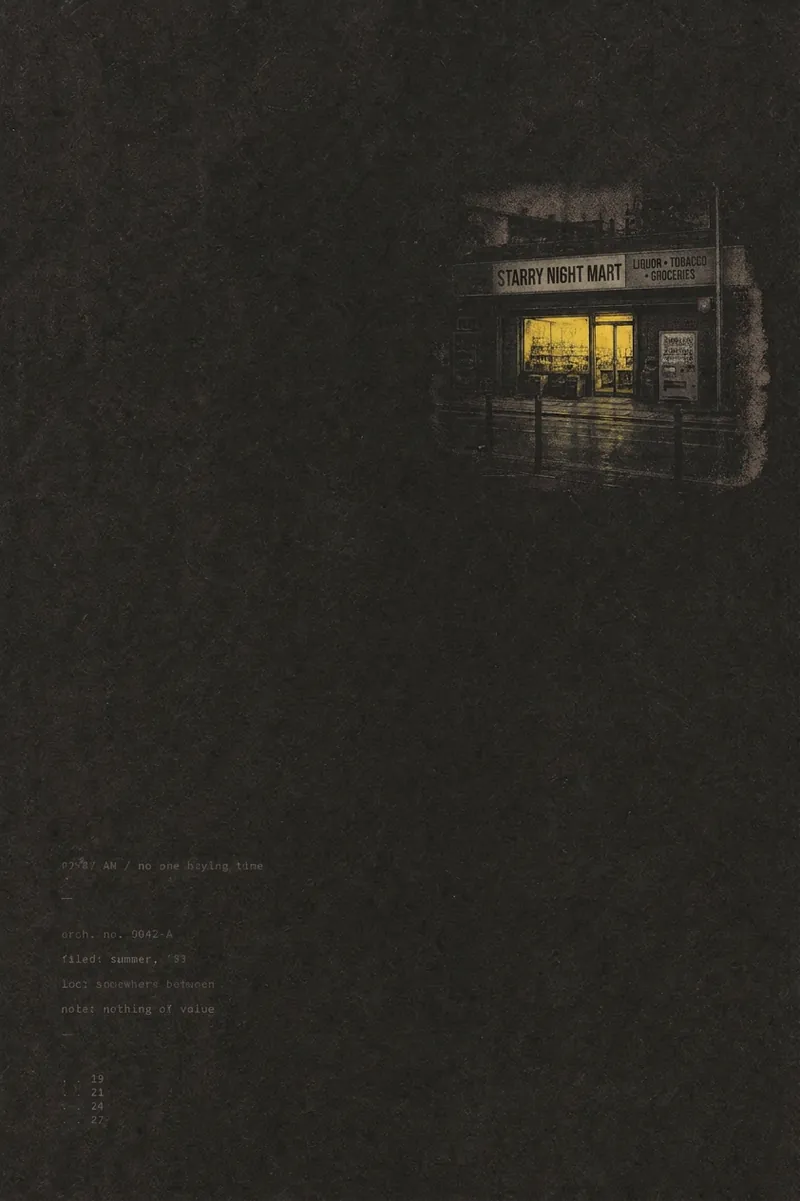
Transform any topic, sentence, object, emotion, article inspiration, photo, or content brief into a quiet minimalist zine-style editorial poster—while also outputting the image and the prompt used to generate it. Vertical 3:5 aged paper canvas, 70-90% whitespace, one high-saturation color anchor, paired with serif/typewriter fonts and scanned paper texture, with a Japanese-Korean independent zine aesthetic.
 Webpage
Document to Accordion Gallery
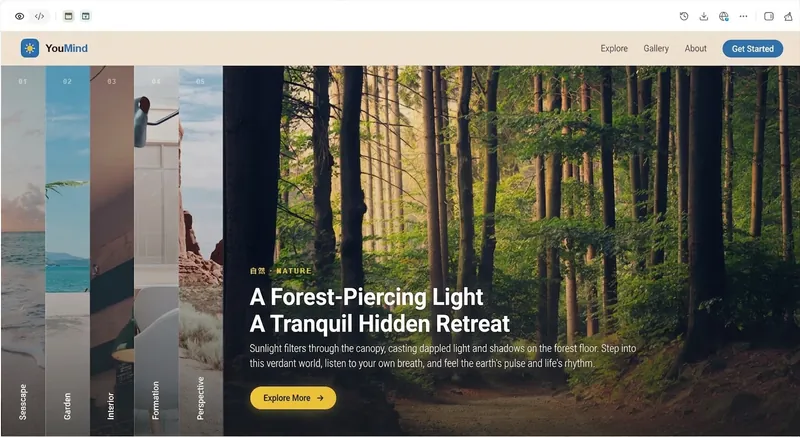
Automatically decompose product introduction documents into horizontal accordion card galleries, extract colors from brand guidelines to generate AI illustrations, and output a shareable interactive webpage. https://youmind.com/a/jLpgKPahOY1tJF

Generate Social Media Graphics
Convert articles/copy into Xiaohongshu image sets or WeChat Official Account covers. Supports dual visual systems (e-magazine style/Swiss style), intelligently matches layouts and colors, automatically searches for matching images or uses user materials, generating 3-9 professional image cards.
 Webpage
HTML PPT Studio
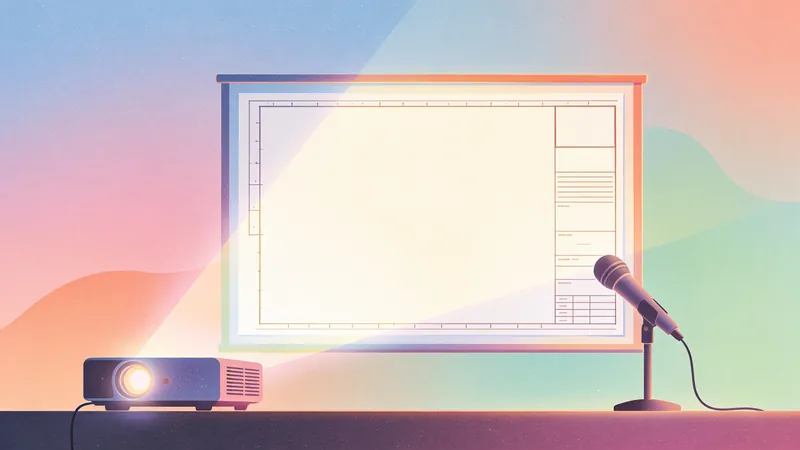
Generate professional-grade static HTML presentations based on user needs, with 36 themes, 31 layouts, 47 animations, and speaker mode. Supports logo, and the single file runs directly in the browser.
 Image
ImageResearch Paper Infographic
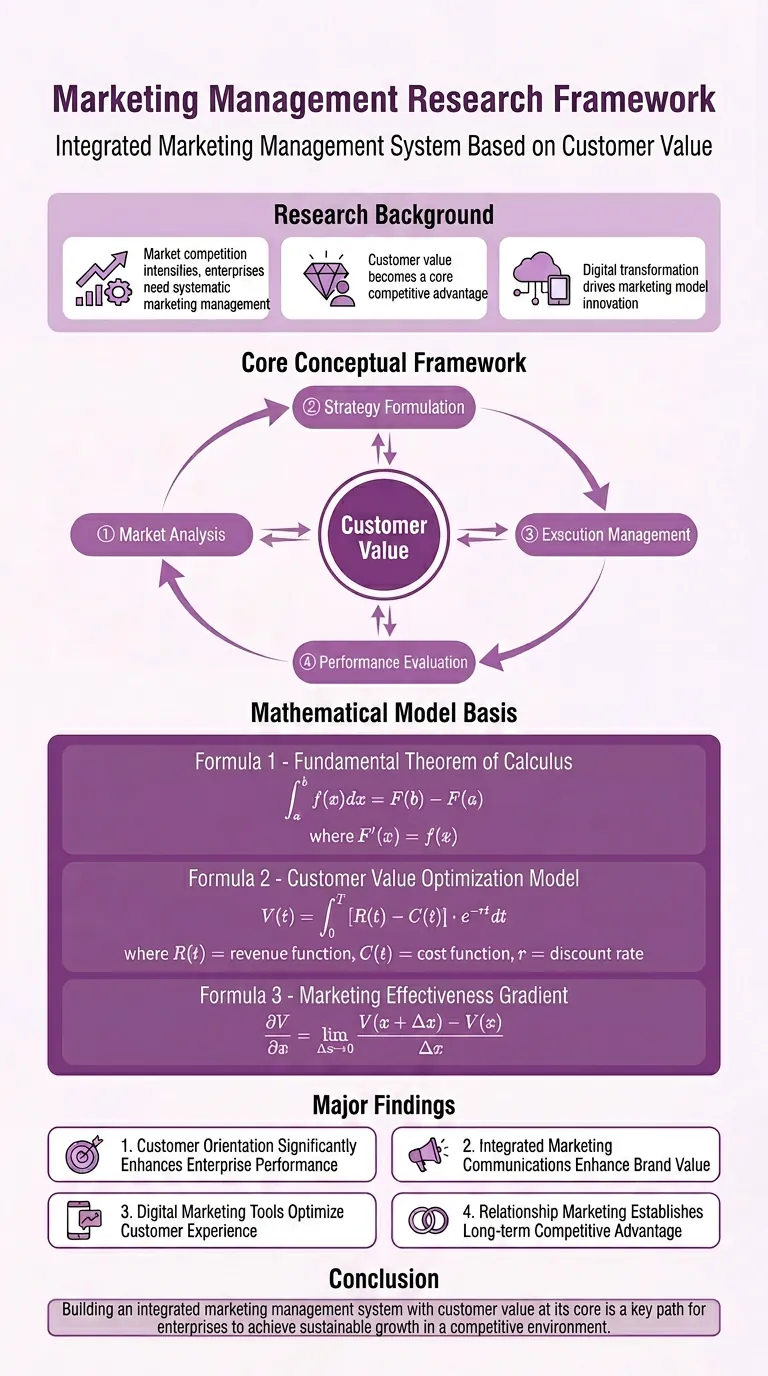
Easily transform your scientific research paper content into professional, high-definition academic infographics. Supports 18 mainstream types, making complex research results clear at a glance. Whether showcasing core mechanisms, experimental workflows, or creating graphical abstracts and technical roadmaps, this tool delivers precise results. We understand the rigor required in scientific illustrations, so beyond visual appeal, we prioritize scientific accuracy to ensure every image is clear and free of misleading information. You can directly provide the full paper, key sections, or a research description, and select the most suitable graph type, such as intracellular mechanism diagrams, tumor immune microenvironment diagrams, material catalysis mechanism diagrams, etc. We also offer a variety of color schemes like blue-green, orange, purple, and chart structure styles like left-label and vertical flow, making your infographics both academically compliant and professionally aesthetic. Beyond traditional academic graph types, this tool also supports 15 creative templates for scientific visualization scenarios, helping you turn research concepts into unique visual works such as magazine-quality posters, interface breakdowns, app design boards, etc., suitable for group meetings, social media, or report covers. We provide a strict controllability checklist and a three-step verification process, and support partial modifications to generated images, ensuring every step closely matches your needs, presenting your research results in the most intuitive and accurate way.
 Image
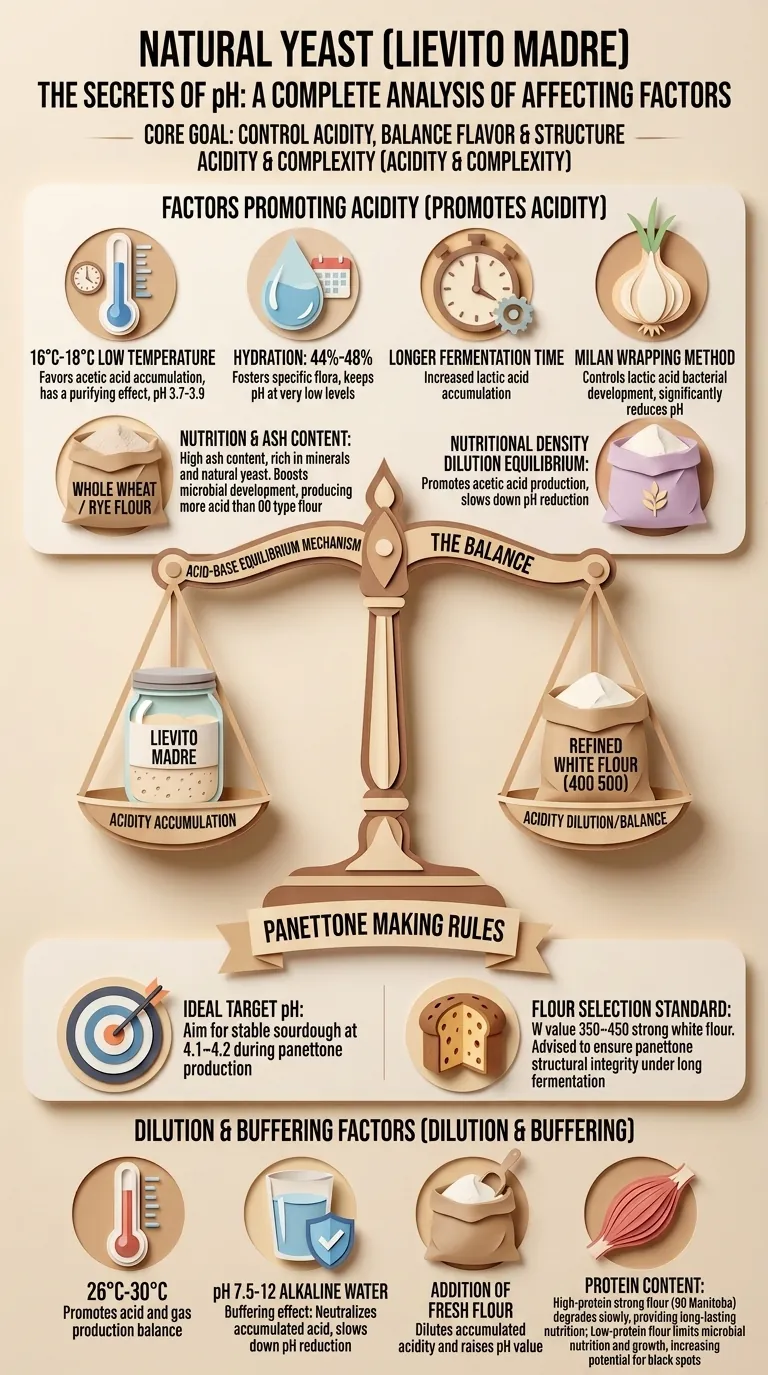
Image3D Paper-Cut Science Diagram
Automatically generate 3D paper-cut style educational science illustrations for articles or topic keywords.
 Image
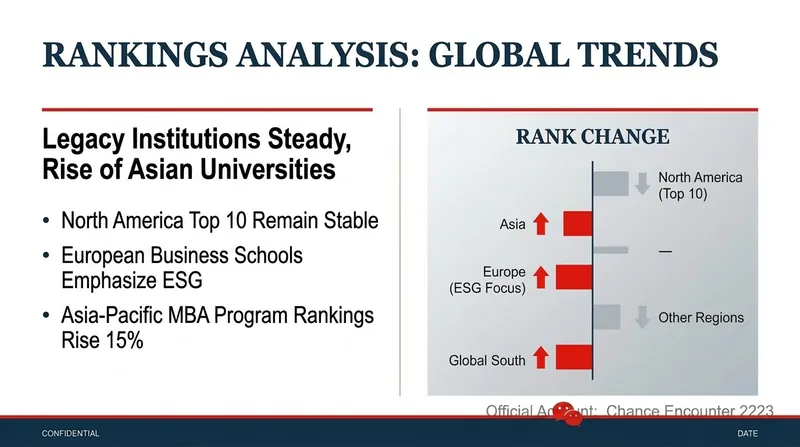
ImageEconomist-style Chart Generator
Senior information design consultant, skilled at transforming complex text into clear visual charts. Expert in The Economist magazine's visual style: minimalist, data-driven, professional and rigorous.