
Infographic Poster Generator
Transform complex topics into radial infographic posters
Infographic Poster Generator
Transform complex topics into radial infographic posters
Showcase
Description
Organize a topic into an infographic poster that combines verifiable sources with visual storytelling. It is well-suited for content that requires categorization, comparison, or relationship mapping, such as natural science, history and culture, social issues, product knowledge, and complex concepts, allowing readers to quickly grasp the full picture through a clear layout. The poster defaults to a vertical Chinese format, establishing a reading entry point with a prominent top-left title and introduction, complemented by a large right-shifted radial infographic, a central theme image, classification legends, peripheral annotations, and bottom source information to create an editorial reading flow. It maintains ample whitespace and a clear information hierarchy while adapting color schemes, illustrations, and icon styles to suit the theme, avoiding content clutter or overly distracting decoration. When dealing with facts, statistics, rankings, and other verifiable information, it checks numbers, units, and dates against reliable sources and briefly notes the sources on the poster. When reliable data is available, it uses appropriate graphical expressions; when comparable data is absent, it clearly states that the sectors are for classification purposes only and do not imply proportional relationships. You can also specify the language, aspect ratio, or other visual requirements to ultimately receive a ready-to-use infographic poster rather than just a concept or generation prompt.
Recommended by
Dancang
Why we love this skill
Turns complex topics into verifiable, readable infographic posters, uniquely featuring an editorial asymmetric radial layout while verifying facts, distinguishing categorical illustrations from real data, and delivering ready-to-use finished images.
Best for
Ideal for creators, educators, and researchers who need to organize complex topics, relationships, or verifiable facts into clear posters.
How to use this Skill
Provide your input
Enter a topic, optionally adding language, aspect ratio, and visual requirements, or provide source materials and data to include.
Run the Skill
Organizes the topic into a clear radial infographic poster, verifies facts, numbers, units, and dates, and notes necessary sources.
Review your result
Receive a ready-to-use vertical infographic poster featuring a title, introduction, categorized info, notes, and a source section.
Related Skills
View all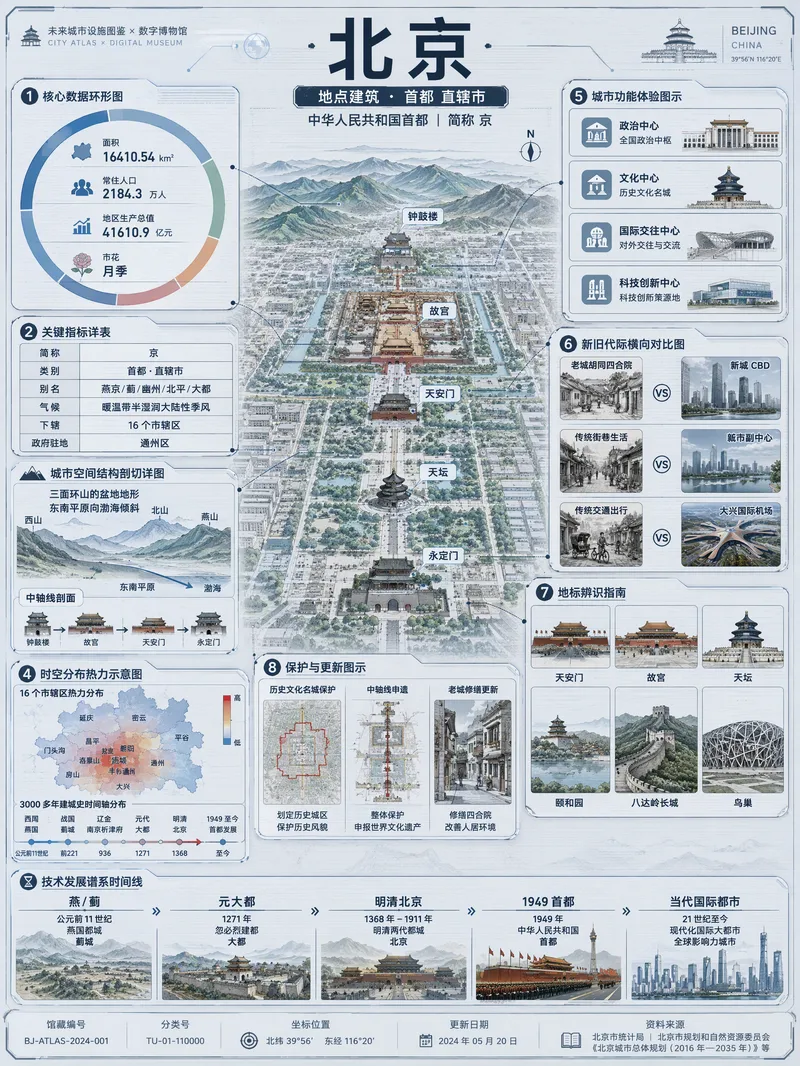 Image
Viral Info Atlas Maker
Quickly turn any subject name into a technology-inspired natural history atlas poster that combines rich information with strong visual appeal. Whether it’s a living thing, mineral or material, man-made object, place or building, cultural concept, or historical figure, the Skill organizes content for display and sharing based on your audience, focus, and language requirements. The Skill first uses real-time web research to verify definitions, key data, structure and composition, distribution, applications, evolution, identifying features, and more. It then arranges the content into a 3:4 vertical infographic. The poster centers on a specimen-style subject, surrounded by nine adaptive information modules covering core metrics, structural analysis, spatial and temporal distribution, context and use cases, comparisons, identification points, conservation or maintenance tips, and a development timeline. Module themes and information priorities are adjusted to fit the type of subject. The finished piece uses light gray-blue technical cardstock, precise linework, low-saturation cyan and blue washes, and a semi-transparent scanned texture. The result combines the visual style of a future-city infrastructure atlas with a digital museum display panel, while retaining the subject label at the top and a collection records area at the bottom. For obscure subjects or when information is limited, speculative content is distinguished with visual prompts. It is suitable for science education, exhibition introductions, knowledge sharing, and social media publishing.
 Image
Viral Infographic Maker
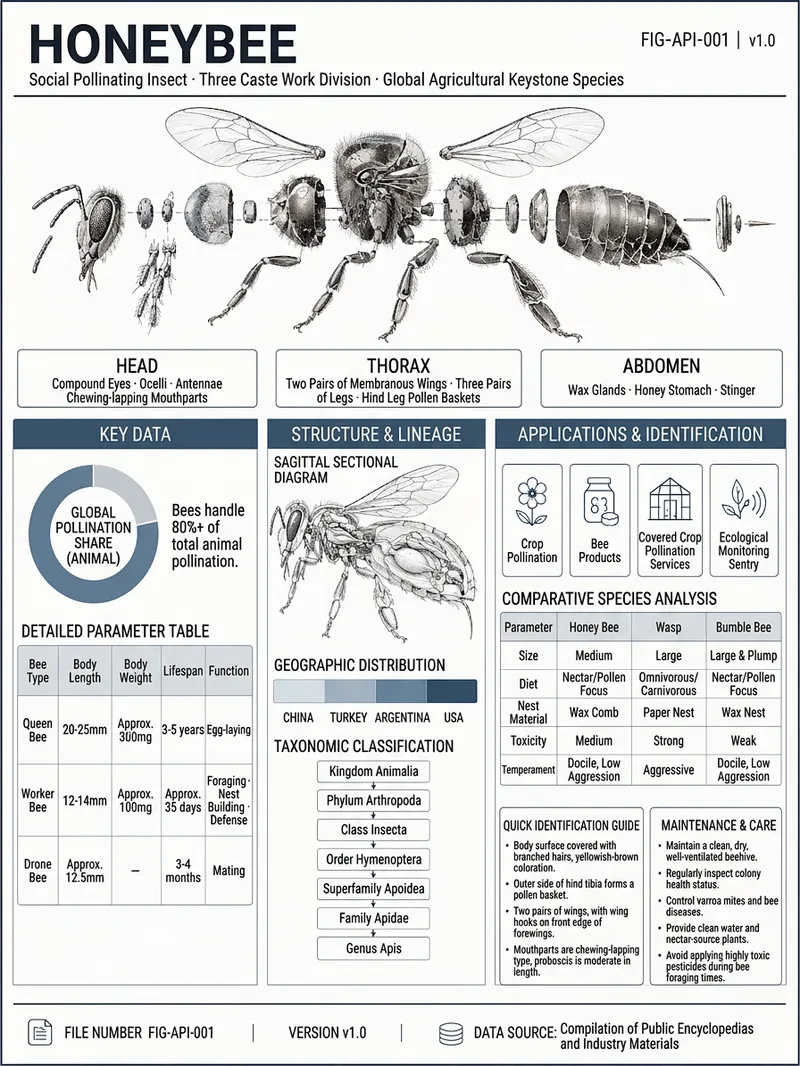
Enter an object name and any optional requirements to receive a research-verified reference infographic about it. Whether it is machinery, an electronic product, a living organism, a building, a vehicle, or a natural object, the system organizes its English name, field, key parameters, structural components, geographic or industry distribution, development lineage, use cases, comparisons with similar objects, identification points, and maintenance recommendations, while recording traceable data sources. Information that cannot be confirmed is clearly marked “Unverified.” The finished design uses a low-saturation gray-blue industrial drafting style, with an exploded view of the main subject and structural cross-section diagrams. Key data is presented as parameter tables, ring charts, distribution maps, lineage diagrams, and comparison panels to help readers quickly understand the object’s appearance, construction, performance, and applications. For abstract or data-based subjects, suitable geometric diagrams or data visualizations are used instead. The final deliverable is a strictly 3:4 infographic poster suitable for high-resolution viewing and print, along with an editable HTML source file. The layout includes title identification, main subject illustrations, structured information modules, and source notes, with a focus on complete content, clear text, and verifiable data.
 Image
Spherical Core Infographic
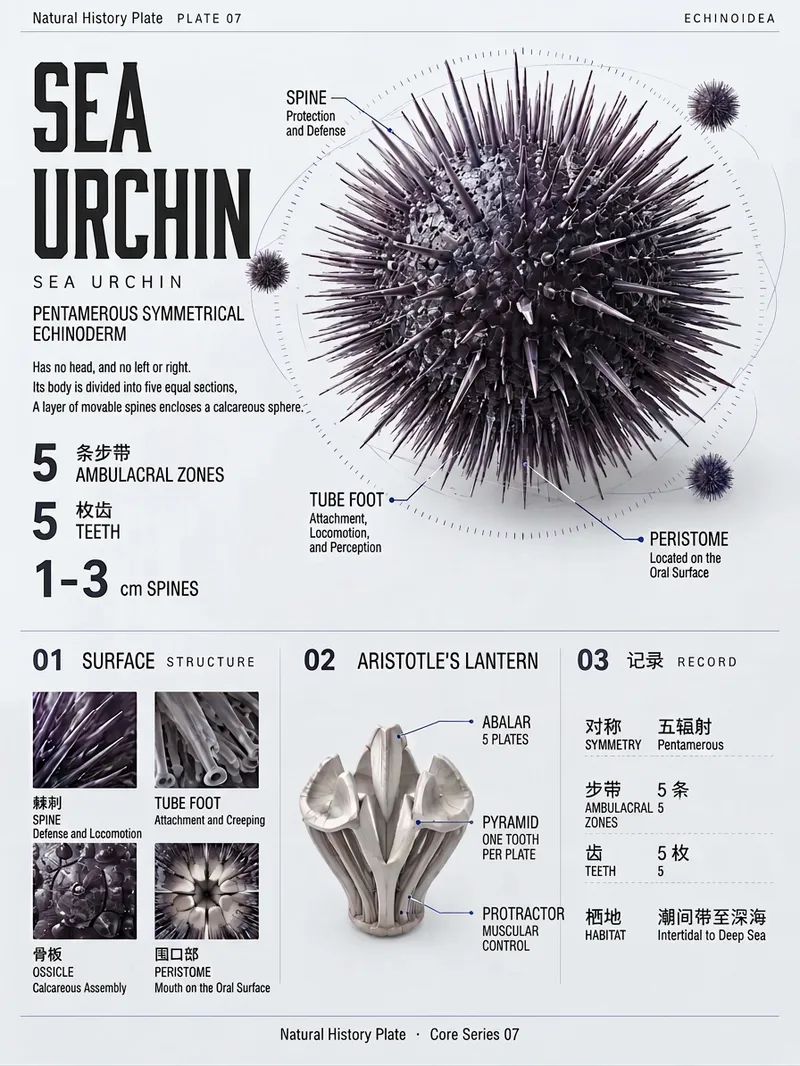
Transform any species, material, artifact, product, celestial body, or natural phenomenon into a distinctive and information-dense spherical core 3D infographic. You can provide a subject name, image, text, or link. Even with incomplete material, it extracts a clear subject and chooses sensible cross-sections, aggregates, or cutaways for elongated or flat objects that do not naturally fit a sphere. The final image features an off-center 3D core as the main visual, combined with homotypic protrusions, small-scale reference figures, contour-fitting geometric wireframes, and orbit scales to present surface structures, mechanisms, and data records. A cool grayish-white neutral background paired with a single accent color makes it suitable for science posters, product displays, exhibition visuals, and knowledge illustrations. Chinese titles, English subtitles, numerical info, and detail labels are seamlessly integrated into the graphic while balancing hierarchy, whitespace, and readability. The output includes a vertical infographic, plus a brief explanation of subject selection, accent color, spherical core composition, section layout, text volume, and replaceable themes. It emphasizes verifiable facts and self-consistent data representation while avoiding unfounded exaggerations. Once finished, it verifies subject recognizability, layout proportions, text completeness, and visual consistency.
Information
- Version
- v3
- Last updated
- Runtime credits
- Usage-based
- Models
- Auto
- Use cases
- Images & designResearch & analysisLearning & education
- What you get
- Image
- Visual styles
- Editorial