Infographic to Visual Explainer
Turn complex information into compelling visual stories
Infographic to Visual Explainer
Turn complex information into compelling visual stories
Showcase
Description
Transforms text, documents, research, statistics, and complex concepts into clear, accurate, visually engaging infographics. Selects the most suitable visual format—such as timelines, workflows, comparisons, diagrams, hierarchies, and data visualizations—based on the information provided.
Related Skills
View all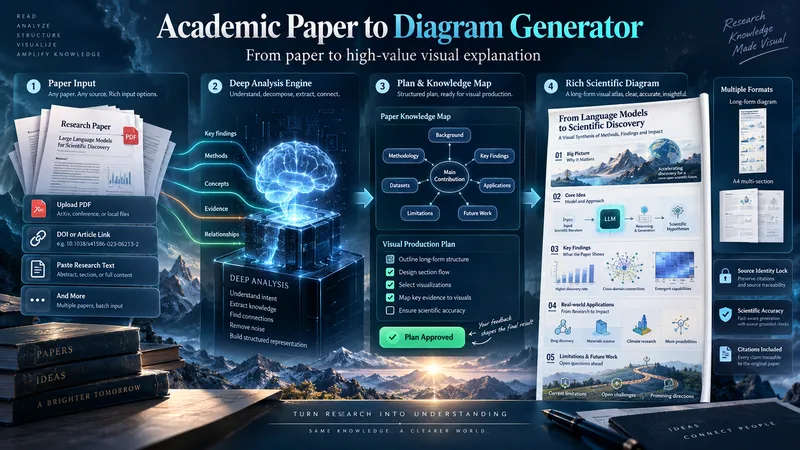 Image
Academic Paper to Diagram Generator
Transform academic papers into detailed, scientifically faithful visual diagrams. The skill deeply analyzes the paper, identifies its most valuable concepts, mechanisms, methods, findings, and relationships, then builds a visual plan with you before generation. Instead of forcing every paper into a small infographic, it can create long vertical diagrams, wide technical maps, multi-section visual explainers, or A4-ready 2–3 part layouts when needed. The visual style is adapted to the subject, with room for AI-driven creativity, scientific illustration, data integration, annotations, and topic-specific visual storytelling. You can start with a PDF, URL, DOI, pasted text, or a request to find a suitable paper. The diagram language is user-approved, the source identity is locked for accuracy, and the final image is generated only after you review the visual plan and production prompt.
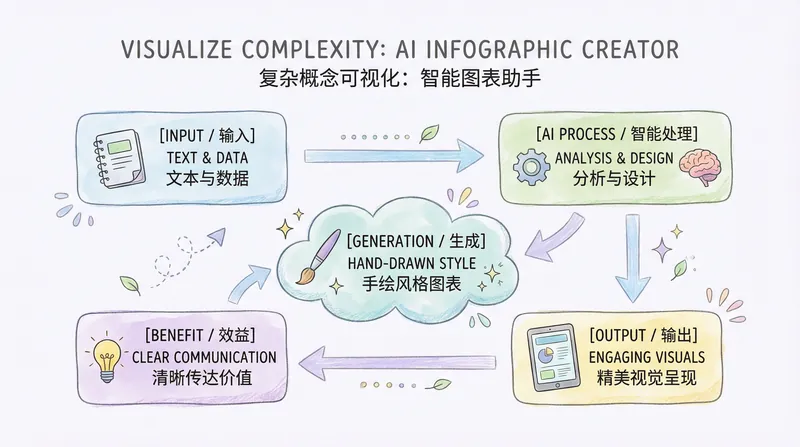
Cute hand-drawn infographic
Transform complex topics into engaging visuals. Create stunning, hand-drawn infographic illustrations in a soft pastel watercolor style, perfect for educational content.
 Image
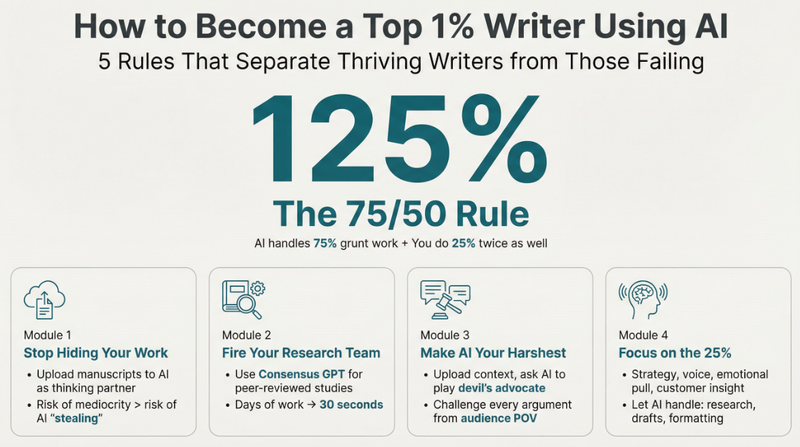
Minimalist Infographic
Turn any complex content into crystal-clear infographics. Design like a pro, ensuring your message is visually quiet yet powerfully impactful, guiding your audience effortlessly.
Information
- Version
- v2
- Last updated
- Runtime credits
- Usage-based
- Models
- Auto