One-Click Medical Infographics
Turn medical source text into red-blue posters
One-Click Medical Infographics
Turn medical source text into red-blue posters
Showcase
Description
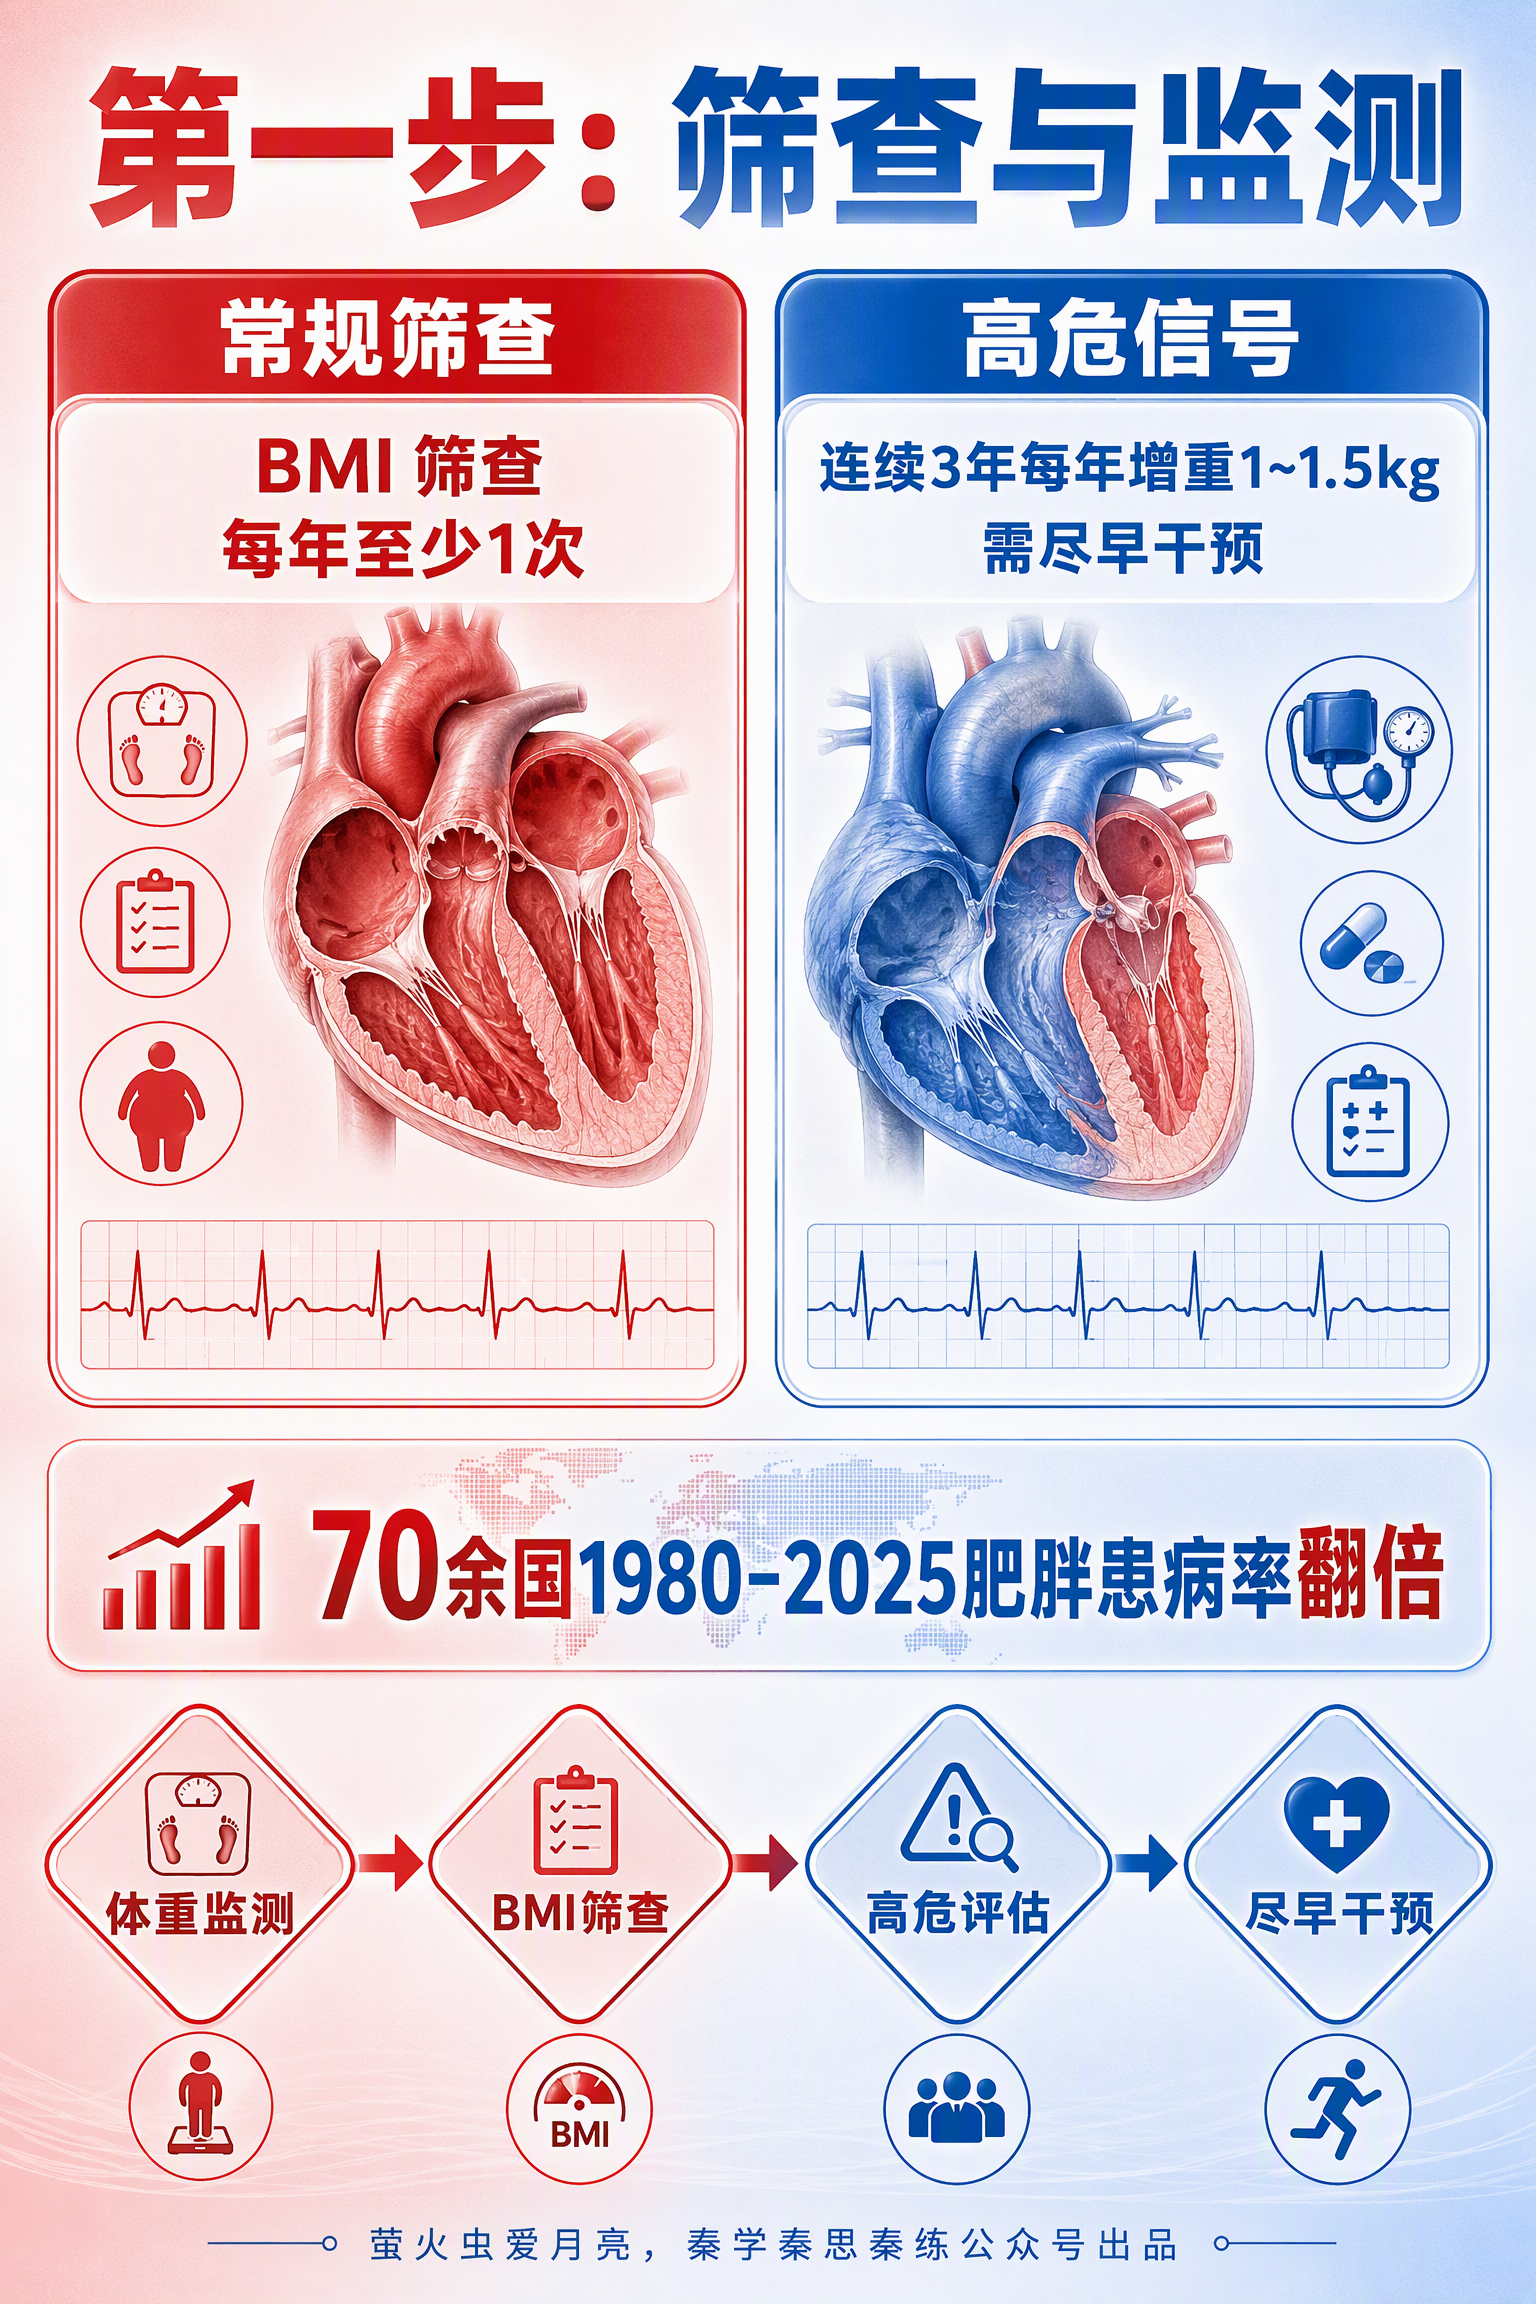
Medical professionals and science communicators, take note: I can faithfully distill medical source text into classic red-and-blue comparison-style health education posters and generate finished images in one click! Ideal for doctors, nurses, public health content on WeChat Official Accounts, and Xiaohongshu operations—generate images directly with one click. Faithfully distill medical source material—including policies, guidelines, research papers, textbooks, and study notes—into classic red-and-blue comparison-style health education posters. PDF text extraction, pasted text, and web links are supported. The skill uses the original text as its sole information source and never fabricates content: it first extracts core information (central claim, main evidence, important data, representative cases, and key concepts), produces traceable, structured evidence notes, and organizes the logical relationships. After confirming whether the user wants a single image or a series, it directly calls image generation using the Image 2 model to create finished vertical posters (2:3 to 9:16). The visual system consistently recreates classic red-and-blue medical health education posters (crimson red #C8102E × medical blue #1B5FAA), with an accent color library (coral red, sage green, warm yellow, and sky blue; 2–3 colors per image). Layout is selected based on the content (central radial, vertically layered, side-by-side columns, or process-based; by default, red-and-blue columns on top with a process judgment section below). Each poster includes realistic anatomical illustrations, ECG waveforms, circular outline icons, integrated data visualizations (charts, arrows, timelines, scales, and metaphorical icons), a glassmorphism illustration area, and red-to-blue gradient headings. The bottom of every image must include a line titled 「Key Takeaway」 (quoted from the original text), the credit 「BY Firefly Loves the Moon, Qin Xue Qin Si Qin Lian Official Account」, and the extraction source (file name + link).
Related Skills
View all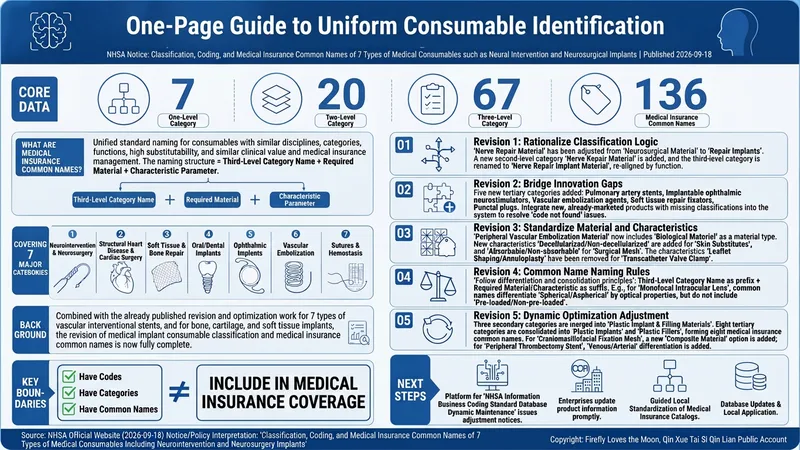
Policy & News Slides Maker
Submit a link, PDF, or text containing a policy, news item, or official document, including an official announcement. The system first extracts the complete source accurately, then conducts a structured review based on the original text—organizing key points, applicable audiences, effective dates, key provisions, and impacts. It supports line-by-line comparison with the source and side-by-side comparison of multiple documents. It then plans the cover, agenda, content, and closing pages through a standard workflow and generates a business-professional visual PPT featuring data visualizations, process diagrams, timelines, tiered topology diagrams, and Bento grid cards. Key data and core arguments are prominently presented. The original text remains the sole source of facts throughout to prevent AI fabrication. Each page footer includes a specific source, while the header or footer includes copyright text (default: “萤火虫爱月亮,秦学秦思秦练公众号”; replace as needed).
 Image
ImageInfographic Maker
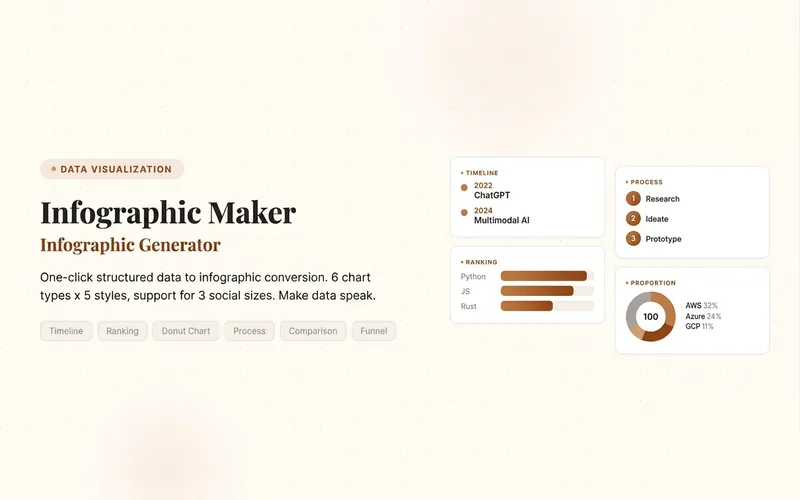
Easily turn any article, table, link, or casual note into a professional infographic, making your data and insights stand out. Whether it's a single poster or a multi-page carousel, this tool intelligently identifies content structure and automatically extracts key information—no manual formatting required. Choose from six chart types: timeline, flowchart, ranking, proportion, comparison, or funnel, and pair them with visual styles like Business Blue, Creative Color, Dark Tech, Elegant Warm, Minimalist Black & White, or Xiaohongshu-exclusive styles. We specially support Chinese content and brand colors to ensure visuals are both professional and aligned with your brand identity. Whether for annual reports, social media (e.g., Xiaohongshu, Instagram, X), or study notes, this tool generates high-resolution PNG images in multiple sizes, helping your information spread in the most appealing way. Say goodbye to tedious design work—create stunning infographics with one click, letting data speak and stories come alive. Companion tools: For final drafts to be published on WeChat Official Accounts, look for '公众号排版器'; for data tables needing publication-grade formatting, look for 'TableCraft'; for quote card sets, look for '知识卡片生成工坊'.
Policy Deep Dive Infographics
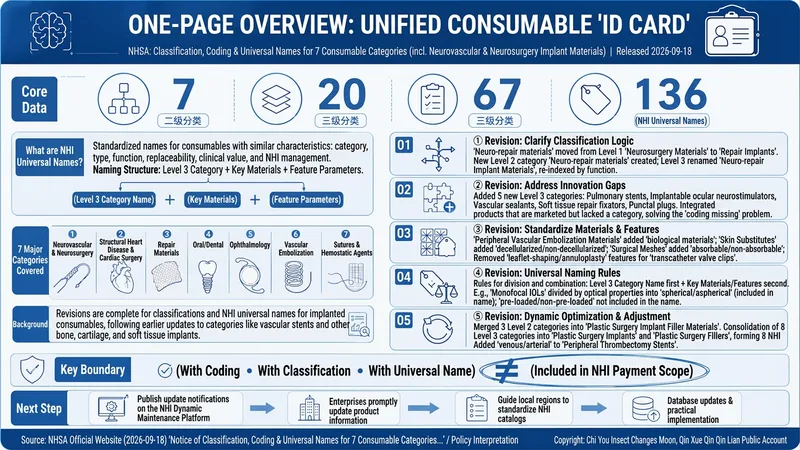
A no-fabrication policy deep-reading and infographic skill for journalists and policy researchers. Provide the latest policy text, official documents, or news links. The skill first sorts the materials into three levels: A. policy text, B. official interpretation, and C. media reports. It then builds an evidence table with verbatim, traceable quotes and applies three verification labels: verified, pending confirmation, and not mentioned in the source. Next, it produces a deep read using a fixed five-question framework: What does it require? What changes? What are the red lines? When does it take effect? Who is affected? Finally, it creates a high-density infographic with a visual style consistent with the existing style: Klein blue clipboards and folders, a creamy beige background, orange index tabs, a neo-skeuomorphic look, key information in bold red, and the fixed attribution 「萤火虫爱月亮,秦学秦思秦练公众号」. The core goal is that every number on the graphic can be located in the source text—no additions or calculations, and no treating media interpretation as policy text. After completing the first step, the skill pauses for user confirmation before proceeding to the deep read and infographic creation.
Information
- Version
- v10
- Last updated
- Runtime credits
- Usage-based
- Models
- Auto
