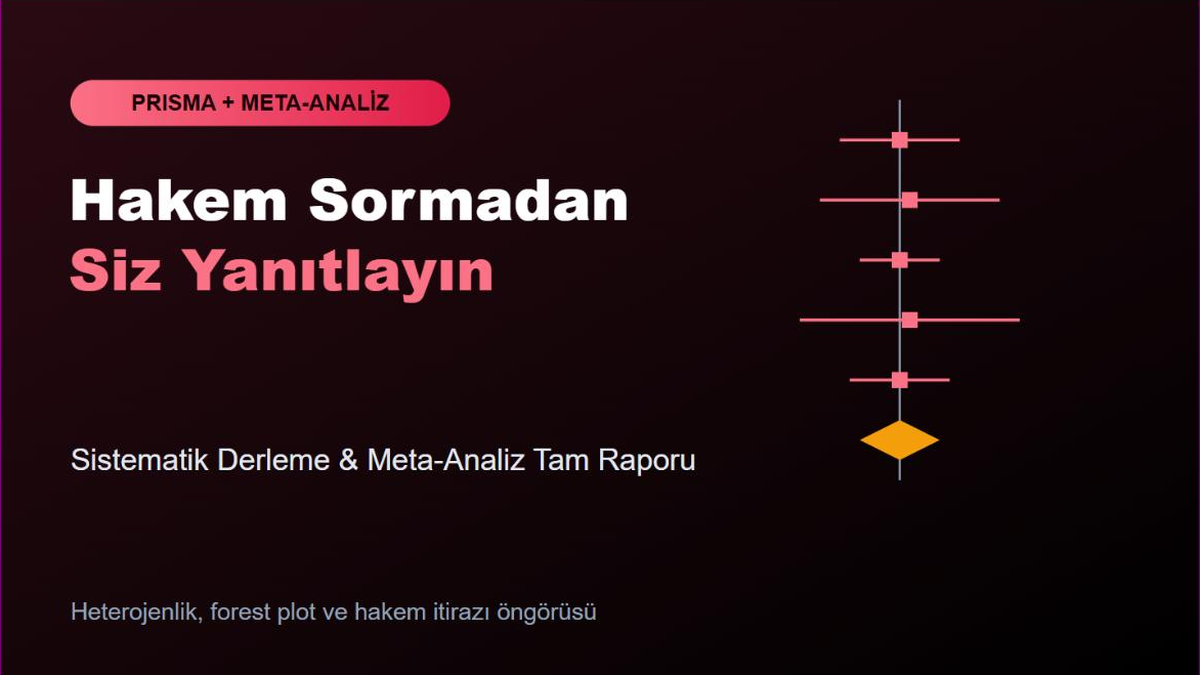
Meta-Analysis Report
Create PRISMA-aligned reports from meta-analysis statistics
Meta-Analysis Report
Create PRISMA-aligned reports from meta-analysis statistics
Showcase
Description
Produces a complete Methods + Results + Limitations text from your meta-analysis statistics (pooled effect size, I², Q, tau², and publication bias indicators), in line with PRISMA 2020 and the Cochrane Handbook. It never misinterprets I² values (including the percentage of variance explained) and avoids overstated causal language, using cautious wording such as “the findings are consistent with...” instead of “the evidence shows that...”. It also provides at least three potential reviewer questions and response statements that can help address them. Suitable for researchers writing a meta-analysis paper who want to strengthen their Methods section before journal submission. What it does not do: it does not calculate statistics from raw data (you must already have calculated your R/RevMan/CMA output); it only converts and interprets the results as academic text.
Recommended by
Shuting@YouMind
Why we love this skill
Transforms raw meta-analysis statistics into publication-ready Methods and Results text aligned with PRISMA 2020 and Cochrane principles, while carefully addressing heterogeneity, bias, causality, limitations, and reviewer questions.
Best for
For researchers preparing a meta-analysis paper who want to strengthen their reporting before submission.
How to use this Skill
Provide your input
Provide the research question, characteristics of the included studies, meta-analysis results, and heterogeneity and publication bias indicators.
Run the Skill
Turns the provided results into academic, cautious reporting language; it does not perform statistical calculations.
Review your result
Receive text covering the Methods, Results, and Limitations sections, along with possible reviewer questions and response statements.
Related Skills
View all Research
PRISMA 2020 Flowchart Writer
For researchers conducting systematic reviews, this Skill generates flowchart text and a protocol paragraph that follow the PRISMA 2020 checklist. When you enter your database screening counts (identification → screening → eligibility → included), it checks the numbers for consistency and produces defensible text addressing a reviewer's question: "Why does your flowchart show so many losses?" It also converts your inclusion and exclusion criteria into a table in PICO/PECO format. This Skill is suitable for graduate students writing systematic reviews or meta-analyses, as well as journal editors conducting pre-publication checks. If it detects a numerical inconsistency (for example, included > eligibility), it states this clearly rather than silently correcting it.
 Research
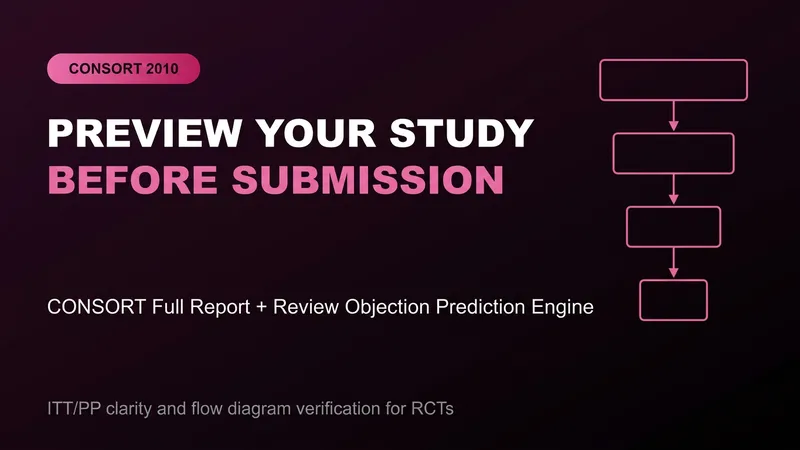
CONSORT 2010 Full Report Writer
Generates a complete Abstract + Methods + Results draft from your randomized controlled trial (RCT) data—randomization method, blinding status, power analysis, CONSORT flow counts (screened/randomized/allocated/analyzed), and ITT/PP analysis approach—in accordance with CONSORT 2010’s 25-item checklist. It never confuses ITT and PP; it checks the consistency of flow diagram counts (randomized ≥ allocated ≥ followed-up ≥ analyzed). It also proactively identifies at least 4 objections frequently raised by journal reviewers (such as “Why was an ITT analysis not reported?”, “Was the success of blinding tested?”, and “Was there any outcome switching?”) and suggests a defense sentence for each. Designed for clinical researchers and academics conducting RCTs in medicine, nursing, or pharmacy who want methodological rigor before journal submission.
 Research
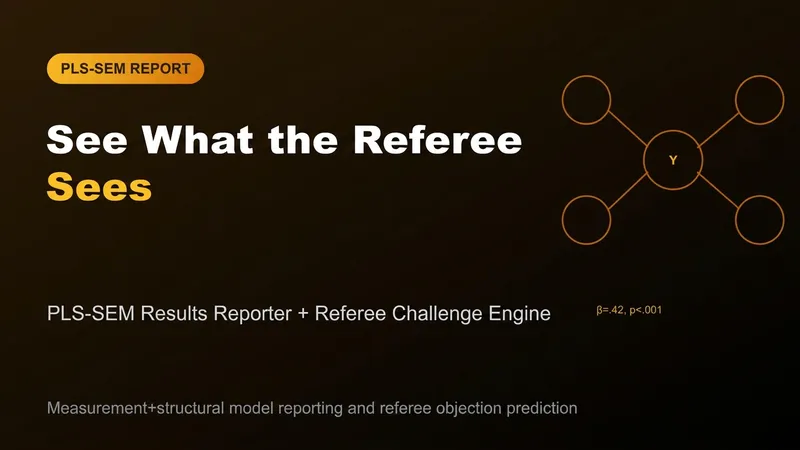
PLS-SEM Report & Rebuttal
Generates a complete Measurement Model + Structural Model report from your PLS-SEM analysis outputs (outer loadings, CR/AVE, HTMT discriminant validity, path coefficients, R²/f²/Q², SRMR). Applies the correct HTMT threshold and R² interpretation (Cohen/Chin criteria) and avoids causal language. It also anticipates at least 4 common journal reviewer objections (e.g., “Why was PLS chosen instead of CB-SEM?” and “CMB was not tested”) and provides a defense statement for each. Suitable for business and social science researchers conducting structural equation modeling with PLS-SEM, and for those seeking methodological rigor before submitting to a journal.
Information
- Version
- v2
- Last updated
- Runtime credits
- Usage-based
- Models
- Auto
- Use cases
- Writing & contentResearch & analysis
- What you get
- ReportDocument