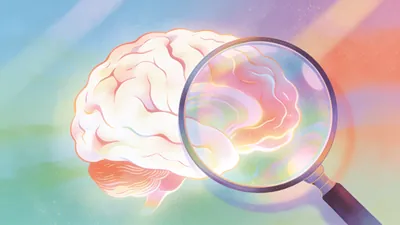
Bento grids infographic
Featured by
nene@YouMind.AI
Why we love this skill
Transform complex information into sleek, modern visuals with this skill. It crafts stunning bento grid infographics, perfect for presenting data with a clean, digital aesthetic. Showcase key metrics and insights in a sophisticated, easy-to-digest format, ideal for reports, presentations, or social media.
Instructions
Select target material and extract essence to the infographic under the below instruction
Modern digital infographic design with a virtual ticket stub and digital receipt aesthetic. Predominantly clean white background with high brightness. Layout organized in a bento grid structure with subtle rounded corners. Use ultra-thin, precise hairline black strokes for outlines and delicate dashed dividers. Elements include crisp sans-serif headers, fine data metrics, barcode strips, and minimalist arrow icons. Sleek, flat design, sharp resolution, electronic interface style, airy and sophisticated tech vibe. No thick heavy borders. --ar 3:4 --v 6.0
description
Ideally for technical roadmaps, project progress workflows, complex concept breakdowns, insider/confidential leaks, and technical specifications. Through minimalist black-and-white high contrast and modular layout, it organizes complex information in an orderly, tech-savvy manner.
Related Skills
View all
Content converted to illusionary text and images v1.0
Convert any text content into a first-person hallucination report with accompanying images. Supports four types of hallucinogens (see Bodhi seed/Mandala/high fever delirium/sleep deprivation 72h+), automatically analyzes content characteristics to recommend the most matching hallucinogen, re-encodes the original content according to the rules of real symptoms, and outputs stream-of-consciousness hallucination text with corresponding style images.
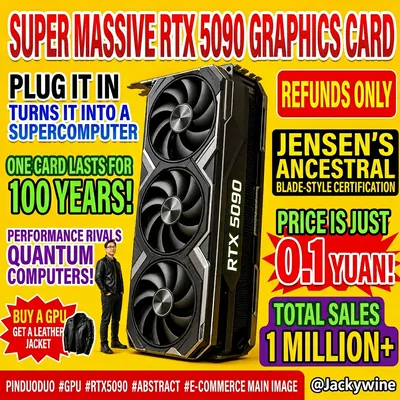
Generate Horse Flat Chart
Users input any product/theme name, and the app automatically generates humorous images in an exaggerated, cheesy e-commerce poster style. Featuring a highly saturated yellow background, dense and chaotic layout, and absurd selling point copy, the style mimics the catchy product images from Pinduoduo/short video platforms.

Xiaolin talks about the cover.
A cover generator for trending topics, modeled after Xiaolin's style. Features: dramatic background theme, extra-large white title, centered figure at the bottom, floating celebrity portraits, English subheadings, high contrast. Suitable for video covers of technology trends, business analysis, and financial news. Supports 3:4 portrait and 4:3 landscape formats.

Bento grids infographic
Featured by
nene@YouMind.AI
Why we love this skill
Transform complex information into sleek, modern visuals with this skill. It crafts stunning bento grid infographics, perfect for presenting data with a clean, digital aesthetic. Showcase key metrics and insights in a sophisticated, easy-to-digest format, ideal for reports, presentations, or social media.
Instructions
Select target material and extract essence to the infographic under the below instruction
Modern digital infographic design with a virtual ticket stub and digital receipt aesthetic. Predominantly clean white background with high brightness. Layout organized in a bento grid structure with subtle rounded corners. Use ultra-thin, precise hairline black strokes for outlines and delicate dashed dividers. Elements include crisp sans-serif headers, fine data metrics, barcode strips, and minimalist arrow icons. Sleek, flat design, sharp resolution, electronic interface style, airy and sophisticated tech vibe. No thick heavy borders. --ar 3:4 --v 6.0
description
Ideally for technical roadmaps, project progress workflows, complex concept breakdowns, insider/confidential leaks, and technical specifications. Through minimalist black-and-white high contrast and modular layout, it organizes complex information in an orderly, tech-savvy manner.
Related Skills
View allContent converted to illusionary text and images v1.0
Convert any text content into a first-person hallucination report with accompanying images. Supports four types of hallucinogens (see Bodhi seed/Mandala/high fever delirium/sleep deprivation 72h+), automatically analyzes content characteristics to recommend the most matching hallucinogen, re-encodes the original content according to the rules of real symptoms, and outputs stream-of-consciousness hallucination text with corresponding style images.
Generate Horse Flat Chart
Users input any product/theme name, and the app automatically generates humorous images in an exaggerated, cheesy e-commerce poster style. Featuring a highly saturated yellow background, dense and chaotic layout, and absurd selling point copy, the style mimics the catchy product images from Pinduoduo/short video platforms.
Xiaolin talks about the cover.
A cover generator for trending topics, modeled after Xiaolin's style. Features: dramatic background theme, extra-large white title, centered figure at the bottom, floating celebrity portraits, English subheadings, high contrast. Suitable for video covers of technology trends, business analysis, and financial news. Supports 3:4 portrait and 4:3 landscape formats.
Find your next favorite skill
Explore more curated AI skills for research, creation, and everyday work.