Industry News Deep Analysis
Industry News Deep Analysis
Showcase
Description
After uploading an Excel or CSV file, it automatically performs column identification, cleaning, statistics, keyword and trend analysis, proofreading, and validation, and upon completion, proactively asks whether to generate a report, PPT, or continue deeper analysis.
Related Skills
View all
Data Analysis Pipeline
📊 From raw Excel to reports with charts, all in one pipeline—no more jumping between multiple tools. 🔁 Four-stage analytical relay (AI automatically switches analysis style—no need to manually change models): 🧹 Data cleaning: automatically handles nulls, outliers, formatting, and duplicates, outputting clean tables 🔬 Deep analysis: descriptive statistics, correlation, attribution, trends, hypothesis testing, with supporting data evidence 📈 Visualization: automatically selects optimal chart types—2–4 core charts explained in one sentence 📝 Report writing: conclusion-first, well-structured analysis reports in Chinese, with actionable recommendations 👥 Use cases: business data analysis, operational reviews, financial reports, user behavior research, academic data exploration—any scenario where you need to turn tables into insights. 💡 Default output is Markdown reports, convertible to Word/PPT. Report style automatically adjusts based on the reader's role (manager/colleague/yourself).

Research Report Generator
📝 Value in one sentence: Enter a topic or upload materials, and AI handles the entire process from organizing sources to drafting. 🔍 Core features: Smart source integration: Upload multiple documents and AI automatically extracts key viewpoints, critical data, and representative cases, while removing duplicates and flagging conflicts. Automatic outline generation: Based on the topic or source content, it creates a logically clear and well-structured article outline. One-click draft writing: Generates content section by section according to the outline, with every data point and case study source-tagged and traceable. Five writing styles: Supports formal reports, WeChat articles, Xiaohongshu notes, academic papers, and business briefings. Transparent citations: Every figure and viewpoint is marked with its source—no fabrication or invention. Automated content workflow: Source parsing → viewpoint extraction → outline generation → writing in five styles. 🎯 Use cases: 📊 Industry research: Enter "Humanoid Robot Industry 2026" to generate a draft analysis report with data and case studies. 📝 Content creation: Upload 3 related articles to combine into an in-depth WeChat article. 📚 Academic writing: Upload multiple paper abstracts to create a literature review draft. 📋 Competitor analysis: Upload several competitor documents to instantly generate a comparative analysis report. 🧠 Personal learning: Enter a new-domain topic to quickly generate a knowledge overview. 💼 Business decisions: Input business data and background information to produce a decision brief for the CEO. 👩💼 Who it's for: Researchers, analysts, content creators, product managers, students, and consultants—anyone who needs to quickly produce high-quality first drafts.
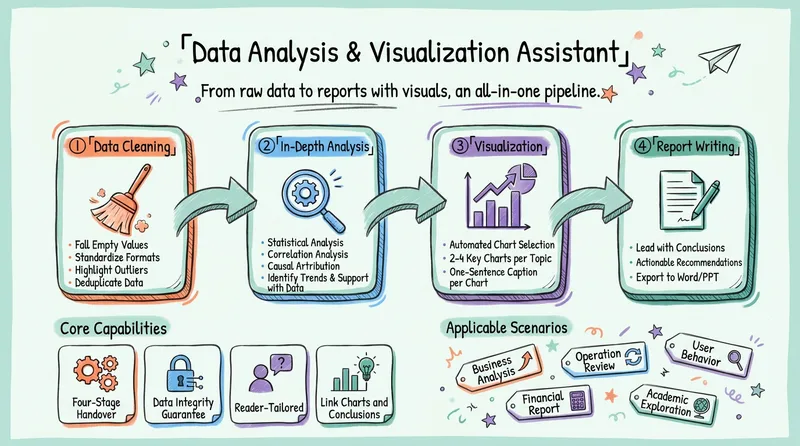
Data Analysis & Visualization V2
From raw tables to reports with charts, this four-step pipeline runs everything in one go: data cleaning → in-depth analysis → visualization → a Chinese report that leads with conclusions. It automatically adapts to the reader’s role and can export to Word/PPT.
Information
- Version
- v1
- Last updated
- Runtime credits
- Usage-based
- Models
- Auto
