Featured by
nene@YouMind.AI
Why we love this skill
Transform any topic into a captivating TED-style presentation with this expert guide. It meticulously outlines narrative structure, visual aesthetics, and even animation principles, ensuring your ideas are presented with the clarity and impact of a world-class talk. Craft compelling stories and visuals that truly resonate with your audience.
Instructions
# TED-Style Presentation Creation Prompt
Act as a world-class TED talk designer and create a complete presentation deck based on the provided article/topic, following TED's "ideas worth spreading" narrative philosophy and visual language.
---
## Narrative Structure Design (Must Strictly Follow)
### Slide 1: Opening Hook
**Goal:** Capture attention in the first 30 seconds, create a knowledge gap
- **Content Options** (choose one):
- Shocking data comparison ("Every 6 seconds...")
- Counter-intuitive statement
- Curiosity-provoking question ("What if I told you...")
- Key moment from a personal story ("Three years ago, on that night...")
- **Visual Requirements:** One oversized core element + minimalist background to create suspense
### Slide 2: Why This Matters
**Goal:** Build emotional connection, make the audience realize "this relates to me"
- Use 2-3 sentences to explain the universality or urgency of the problem
- Show the scale or scope of people affected
- **Visual Strategy:** Use silhouettes, maps, or group icons to create resonance
### Slides 3-4: Current Dilemma
**Goal:** Depict "where we are now," establish the necessity for change
- Show current problems with specific cases or data
- Highlight limitations of traditional approaches
- **Visual Rhythm:** From broad to specific, from abstract to tangible
### Slide 5: Turning Point/Personal Epiphany
**Goal:** The signature TED "aha moment"
- Tell the moment of discovering a new perspective ("Until I realized...")
- Show the shift or breakthrough in thinking
- **Visual Design:** Use light, arrows, or perspective changes to symbolize cognitive leap
### Slides 6-8: Core Idea Expansion
**Goal:** Deep dive into "one core idea" (the 18-minute talk golden rule)
- **Slide 6:** Clear statement of core idea (one-sentence essence)
- **Slide 7:** Three key pieces of evidence/principles supporting the idea
- **Slide 8:** Use analogies or metaphors to make abstract concepts concrete
- Example: "It's like..." / "Imagine a..."
- **Visual Requirements:** Illustrative metaphors, avoid abstract charts
### Slides 9-10: Real Cases/Stories
**Goal:** Make the idea "come alive," build credibility
- Tell 1-2 specific practice cases
- Include a complete narrative arc with characters, conflict, and transformation
- **Emotional Design:** Show real struggles and breakthroughs, avoid perfectionism
### Slide 11: Addressing Potential Objections
**Goal:** Anticipate audience's "but..." questions, enhance persuasiveness
- Honestly acknowledge limitations or challenges
- Use data or logic to resolve concerns
- **Tone:** Humble yet confident, show depth of thinking
### Slides 12-13: Greater Significance
**Goal:** Elevate from individual case to universal value
- Connect to larger social issues, human insights, or future vision
- Answer "So What?"—why this transcends the specific topic itself
- **Visual Elevation:** Use expansive scenes, starry skies, horizons, and other imagery
### Slide 14: Call to Action
**Goal:** Empower the audience, let everyone participate in change
- **Three-Layer Design:**
- One small thing you can do today
- A challenge you can try this week
- A long-term direction you can pursue
- **Language:** Use second person "you can..." rather than preachy "should"
### Slide 15: Poetic Ending
**Goal:** Leave an afterglow, create a memory anchor
- Circle back to the opening question/story, form a narrative loop
- Use one golden sentence or image to freeze the moment (quoted or original)
- **Visual:** Minimalist image + core golden sentence, create contemplative atmosphere
---
## Visual Language Standards (TED Stage Aesthetics)
### Color Philosophy
- **Primary Colors:**
- Background: Deep #1A1A1A (TED stage black) or warm #F5F1ED (knowledge-sharing feel)
- Text: High-contrast pure white #FFFFFF or ink black #0A0A0A
- **Accent Color System** (representing different emotional layers):
- **Curiosity/Inspiration:** TED Red #E62B1E (only for core idea slides)
- **Data/Rationality:** Tech Blue #4A90E2
- **Humanity/Warmth:** Amber Gold #F5A623
- **Usage Rules:**
- Maximum 1 accent color per slide
- Accent color占比不超过15% of the frame
- Gradients limited to single-color transparency changes (100%-0%)
### Typography Rules
#### Title Hierarchy
- **Extra Large Titles** (opening/core ideas):
- Font size: 12-18% of screen height
- Font: Bold sans-serif
- Maximum 7 words, remove all unnecessary articles
- Example: ❌"About the Importance of Innovation" ✅"Redefining Innovation"
- **Regular Titles:**
- Font size: 6-8% of screen height
- White space: At least 1.5x title height above and below
- **Body Text:**
- Font size: 2.5-3.5% of screen height
- Line height: 1.8-2.0x
- Maximum 30 words per slide (about 2 lines)
#### The Power of Numbers
- Key data must:
- Be enlarged to 150-200% of title size
- Stand alone with ample white space around
- Have micro unit labels (1/4 size of number)
- Example: **73%** <sub style="font-size:0.25em">of people will...</sub>
### Visual Focus Strategy
#### Per-Slide Composition Formula
```
1 Visual Anchor (40-60% of frame)
+ 1 Core Message (text or data)
+ Breathing Space (at least 35% white space)
= 1 Slide
```
#### Image Usage Principles
- **Photography:**
- Only for story slides (cases/emotional connection)
- Must be authentic scenes, no stock photos
- Apply B&W filter or monochrome overlay for restraint
- **Icons/Illustrations:**
- Linear style, consistent stroke weight (2-3px)
- Polarized sizing: Either 60% of screen (main visual) or under 8% (supplementary)
- Example scenarios: Hand-drawn arrows for processes, simple figures for characters
- **Data Visualization:**
- No 3D effects or decorative elements
- Show maximum 3-4 data points
- Color only for distinguishing categories, not conveying values
- Prefer: Bar charts (comparison), line charts (trends), single pie charts (proportions)
#### Metaphor Visualization Techniques
- Transform abstract concepts into everyday objects:
- "Complex system" → Gear assembly
- "Connection" → Neural network/constellation lines
- "Growth" → Tree/staircase silhouette
- Use negative space to create dual-meaning graphics
### Layout Grid System
#### Page Structure
- **Full-Screen Immersive:** Content centered vertically + horizontally, margins at least 10% on all sides
- **Asymmetric Balance:**
- Visual center can be off-center but balanced with white space or micro elements
- When text is left/right aligned, place breathing graphic element on opposite side
#### Reading Flow Design
- Left-to-right, large-to-small reading habits
- Place key information in the upper 1/3 "golden sight line zone"
- Sink secondary information to bottom, reduce font to 70% of body text
---
## Interaction & Animation (Enhance Immersion)
### Navigation System
- **Progress Indicator:** Bottom dots (●○○○), current page enlarged and colored
- **Keyboard Shortcuts:**
- Space/Right arrow: Next slide
- Left arrow: Previous slide
- Number keys: Jump to corresponding slide
- **Gestures** (mobile): Swipe left/right to change slides
### Slide Transitions
- **Default Animation:** 0.6s ease-in-out fade
- **Special Moments:**
- Opening to slide 2: Push up
- Turning point slide: Scale fade
- Ending slide: Long fade (1.2s) for afterglow
### Element Entrance
- Title: Opacity 0 to 100%, with slight upward movement (20px)
- Data: Numbers jump from 0 to target value (1s animation)
- Images: Blur to clear (blur 10px → 0px)
---
## Content Creation Checklist
### Narrative Completeness
- [ ] Is there a clear "one core idea" that can be summarized in one sentence?
- [ ] Does the opening create a knowledge gap within 30 seconds?
- [ ] Is there at least 1 real story (not pure theory)?
- [ ] Is there an "aha moment" designed?
- [ ] Does the ending provide specific, actionable suggestions?
### Emotional Curve
- [ ] Are emotional ups and downs designed (curiosity→surprise→reflection→hope)?
- [ ] Is vulnerability or failure shown to build trust?
- [ ] Is the tone conversational rather than preachy?
### Visual Consistency
- [ ] Does each slide have only 1 visual focus?
- [ ] Is white space over 30%?
- [ ] Are accent colors only used for core information?
- [ ] Is the font family unified (maximum 2 fonts)?
### 18-Minute Golden Rule
- [ ] Total slides controlled within 15 (average 1 minute per slide)
- [ ] Can each slide's information be visually captured within 5 seconds?
- [ ] Have all unnecessary modifiers and redundant information been removed?
---
## Example Slide Structure Reference
### Example 1: Opening Hook Slide
```
[Upper 1/3 of screen]
2050
[Extra large bold, 15% of screen height]
[Center-bottom of screen]
Earth will have 10 billion people
But only 60% will have access to clean water
[Regular font size, 2.0 line spacing]
[Bottom of screen]
We have 27 years to change this number
[Small text, 60% opacity]
```
### Example 2: Core Idea Slide
```
[Left 60%]
[TED red color block background, occupying left side]
Education is not
filling a bucket
but lighting a fire
[White bold text centered on color block]
[Right 40%]
— Adapted from Yeats
[Small text annotation]
[Bottom]
This means we need to fundamentally redesign the classroom
[One line of explanatory text]
```
### Example 3: Data Comparison Slide
```
[Screen divided into left and right halves]
[Left half]
73%
[Extra large number, tech blue]
Status in 2023
[Right half]
12%
[Extra large number, amber gold]
Level in 2010
[Center]
[Thin arrow pointing from left to right, indicating trend]
[Bottom center]
Mobile payments changed consumption habits in a decade
```
---
## Final Output Requirements
### Technical Specifications
- Responsive design, supporting 1920×1080 / 1366×768 / iPad / mobile landscape
- Use modern web technologies (HTML5 + CSS Grid/Flexbox)
- Font fallback: English (Inter/Helvetica → Arial), Chinese if needed (Source Han Sans/PingFang → Heiti)
- All animations use CSS transitions/animations, avoid JavaScript performance loss
### Accessibility
- Text-to-background contrast ratio at least 7:1 (WCAG AAA standard)
- Images must have alt descriptions (even decorative graphics should be marked "decorative")
- Full keyboard navigation support
### Deliverables
1. Complete HTML single file (inline CSS)
2. Speaker notes (key points for each slide, separate markdown file)
3. High-resolution exported static images (optional, for social sharing)
---
## Creative Philosophy (Meta-Level Reminders)
> **Remember TED's Core:** It's not about showing how much you know, but igniting the flame of "I want to know more" in the audience's heart.
- For every slide, ask yourself: If the audience gets distracted and checks their phone right now, what do I lose? If the answer is "nothing," delete this slide.
- Data serves the story, not the other way around. Find the story first, then use data to amplify impact.
- The best design is invisible—the audience should remember the idea, not "this PPT is so cool."
- The 18-minute limit is liberation, not constraint. It forces you to find the diamond core of your thought.
**Ultimate Goal:** When the audience leaves the room, they may forget your name, forget your slides, but they'll remember the idea that changed how they see the world.
---
## Important Notes
- All slide content must be in English
- Use simple, powerful English that a global audience can understand
- Avoid jargon unless absolutely necessary, and define it clearly if used
- Ensure cultural sensitivity and universal appeal in examples and metaphors
description
Transform your ideas into captivating TED-style presentations. Craft compelling narratives and stunning visuals that inspire and engage, all with the click of a button.
Related Skills
View all
WeChat Official Account Layout - Indigo Thought Long Article Style
1. The article content is automatically fitted into the theme's WeChat Official Account layout template, generating a preview webpage with a "One-Click Copy Rich Text" button. After copying, it can be directly pasted into the WeChat Official Account editor, and all layout styles are fully preserved. Due to limitations of the WeChat Official Account editor, images need to be added manually. 2. Different models generate varying quality.


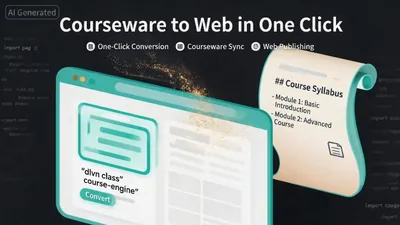
Unfold scrolls into screens: create online courseware with a single click
Turn your course materials into a viewable website. Whether you have Markdown notes, a PDF paper, a PPT presentation, or a plain text script, "Scroll to Screen" can automatically transform it into a well-structured and visually appealing online course presentation webpage. You don't need to write a single line of code; just provide the content. Two presentation styles: Course training content → Generates a scrolling long page, allowing you to flip through it like a book. Paper/report content → Generates a PPT-style flip-page website, allowing you to browse page by page like a presentation. Responsive design adapts to mobile phones and computers. What you need to do: Just one step: Provide your course material. Supports the following formats: .md Markdown files, .pdf PDF documents, .pptx PPT presentations, .txt plain text. You can also directly paste course content text into the dialog. Example instructions: "Help me turn this course handout into a webpage." "Turn this PDF paper into a PPT-style website." "This is my course content; generate an online presentation page." What you will get: A directly accessible online course presentation website with an automatically selected presentation mode based on your content. Course outlines, training handouts, and textbooks: Scrolling long pages with seamless module transitions; academic papers and research reports: PPT-style slideshows with each page focusing on a single point; presentations and conference reports: PPT-style page-by-page presentation with keyboard/click navigation. You explicitly request "scrolling" or "PPT," and it will follow your instructions, respecting user intent. Content extraction capabilities: For information-dense papers and long texts, the skill will automatically perform: Structural decomposition — breaking down continuous arguments into independent chapters/slides; Information condensation — condensing 3 paragraphs into 3 key points, each no more than 20 words; Argument first — Each page presents the conclusion first, followed by supporting arguments and a visual framework—models and classification systems are presented in charts, not just plain text data—key figures and indicators are highlighted on separate pages. Subsequent modifications: After the website is generated, you can request adjustments at any time: "Update the content of Module 3," "Change the color scheme to warm colors," "Add a course roadmap," "Change this module to a timeline layout." Modifications only affect the corresponding parts and do not require regenerating the entire website. What it doesn't do: This skill currently focuses on course content display and does not include the following LMS (Online Learning System) functions: user login/registration, learning progress tracking, file downloads, online quizzes/exercises. These functions are separate extensions.
International Industry Briefing Generator
Generate daily dynamic briefings with international media quality for any industry, covering the entire chain from data collection to content generation, brand layout, publication and archiving, and distribution. It supports seven days and seven colors of Morandi color scheme, three-layer content structure (information → analysis → insight), automatic deduplication, and engineered delivery.
TED style presentation
Featured by
nene@YouMind.AI
Why we love this skill
Transform any topic into a captivating TED-style presentation with this expert guide. It meticulously outlines narrative structure, visual aesthetics, and even animation principles, ensuring your ideas are presented with the clarity and impact of a world-class talk. Craft compelling stories and visuals that truly resonate with your audience.
Instructions
# TED-Style Presentation Creation Prompt
Act as a world-class TED talk designer and create a complete presentation deck based on the provided article/topic, following TED's "ideas worth spreading" narrative philosophy and visual language.
---
## Narrative Structure Design (Must Strictly Follow)
### Slide 1: Opening Hook
**Goal:** Capture attention in the first 30 seconds, create a knowledge gap
- **Content Options** (choose one):
- Shocking data comparison ("Every 6 seconds...")
- Counter-intuitive statement
- Curiosity-provoking question ("What if I told you...")
- Key moment from a personal story ("Three years ago, on that night...")
- **Visual Requirements:** One oversized core element + minimalist background to create suspense
### Slide 2: Why This Matters
**Goal:** Build emotional connection, make the audience realize "this relates to me"
- Use 2-3 sentences to explain the universality or urgency of the problem
- Show the scale or scope of people affected
- **Visual Strategy:** Use silhouettes, maps, or group icons to create resonance
### Slides 3-4: Current Dilemma
**Goal:** Depict "where we are now," establish the necessity for change
- Show current problems with specific cases or data
- Highlight limitations of traditional approaches
- **Visual Rhythm:** From broad to specific, from abstract to tangible
### Slide 5: Turning Point/Personal Epiphany
**Goal:** The signature TED "aha moment"
- Tell the moment of discovering a new perspective ("Until I realized...")
- Show the shift or breakthrough in thinking
- **Visual Design:** Use light, arrows, or perspective changes to symbolize cognitive leap
### Slides 6-8: Core Idea Expansion
**Goal:** Deep dive into "one core idea" (the 18-minute talk golden rule)
- **Slide 6:** Clear statement of core idea (one-sentence essence)
- **Slide 7:** Three key pieces of evidence/principles supporting the idea
- **Slide 8:** Use analogies or metaphors to make abstract concepts concrete
- Example: "It's like..." / "Imagine a..."
- **Visual Requirements:** Illustrative metaphors, avoid abstract charts
### Slides 9-10: Real Cases/Stories
**Goal:** Make the idea "come alive," build credibility
- Tell 1-2 specific practice cases
- Include a complete narrative arc with characters, conflict, and transformation
- **Emotional Design:** Show real struggles and breakthroughs, avoid perfectionism
### Slide 11: Addressing Potential Objections
**Goal:** Anticipate audience's "but..." questions, enhance persuasiveness
- Honestly acknowledge limitations or challenges
- Use data or logic to resolve concerns
- **Tone:** Humble yet confident, show depth of thinking
### Slides 12-13: Greater Significance
**Goal:** Elevate from individual case to universal value
- Connect to larger social issues, human insights, or future vision
- Answer "So What?"—why this transcends the specific topic itself
- **Visual Elevation:** Use expansive scenes, starry skies, horizons, and other imagery
### Slide 14: Call to Action
**Goal:** Empower the audience, let everyone participate in change
- **Three-Layer Design:**
- One small thing you can do today
- A challenge you can try this week
- A long-term direction you can pursue
- **Language:** Use second person "you can..." rather than preachy "should"
### Slide 15: Poetic Ending
**Goal:** Leave an afterglow, create a memory anchor
- Circle back to the opening question/story, form a narrative loop
- Use one golden sentence or image to freeze the moment (quoted or original)
- **Visual:** Minimalist image + core golden sentence, create contemplative atmosphere
---
## Visual Language Standards (TED Stage Aesthetics)
### Color Philosophy
- **Primary Colors:**
- Background: Deep #1A1A1A (TED stage black) or warm #F5F1ED (knowledge-sharing feel)
- Text: High-contrast pure white #FFFFFF or ink black #0A0A0A
- **Accent Color System** (representing different emotional layers):
- **Curiosity/Inspiration:** TED Red #E62B1E (only for core idea slides)
- **Data/Rationality:** Tech Blue #4A90E2
- **Humanity/Warmth:** Amber Gold #F5A623
- **Usage Rules:**
- Maximum 1 accent color per slide
- Accent color占比不超过15% of the frame
- Gradients limited to single-color transparency changes (100%-0%)
### Typography Rules
#### Title Hierarchy
- **Extra Large Titles** (opening/core ideas):
- Font size: 12-18% of screen height
- Font: Bold sans-serif
- Maximum 7 words, remove all unnecessary articles
- Example: ❌"About the Importance of Innovation" ✅"Redefining Innovation"
- **Regular Titles:**
- Font size: 6-8% of screen height
- White space: At least 1.5x title height above and below
- **Body Text:**
- Font size: 2.5-3.5% of screen height
- Line height: 1.8-2.0x
- Maximum 30 words per slide (about 2 lines)
#### The Power of Numbers
- Key data must:
- Be enlarged to 150-200% of title size
- Stand alone with ample white space around
- Have micro unit labels (1/4 size of number)
- Example: **73%** <sub style="font-size:0.25em">of people will...</sub>
### Visual Focus Strategy
#### Per-Slide Composition Formula
```
1 Visual Anchor (40-60% of frame)
+ 1 Core Message (text or data)
+ Breathing Space (at least 35% white space)
= 1 Slide
```
#### Image Usage Principles
- **Photography:**
- Only for story slides (cases/emotional connection)
- Must be authentic scenes, no stock photos
- Apply B&W filter or monochrome overlay for restraint
- **Icons/Illustrations:**
- Linear style, consistent stroke weight (2-3px)
- Polarized sizing: Either 60% of screen (main visual) or under 8% (supplementary)
- Example scenarios: Hand-drawn arrows for processes, simple figures for characters
- **Data Visualization:**
- No 3D effects or decorative elements
- Show maximum 3-4 data points
- Color only for distinguishing categories, not conveying values
- Prefer: Bar charts (comparison), line charts (trends), single pie charts (proportions)
#### Metaphor Visualization Techniques
- Transform abstract concepts into everyday objects:
- "Complex system" → Gear assembly
- "Connection" → Neural network/constellation lines
- "Growth" → Tree/staircase silhouette
- Use negative space to create dual-meaning graphics
### Layout Grid System
#### Page Structure
- **Full-Screen Immersive:** Content centered vertically + horizontally, margins at least 10% on all sides
- **Asymmetric Balance:**
- Visual center can be off-center but balanced with white space or micro elements
- When text is left/right aligned, place breathing graphic element on opposite side
#### Reading Flow Design
- Left-to-right, large-to-small reading habits
- Place key information in the upper 1/3 "golden sight line zone"
- Sink secondary information to bottom, reduce font to 70% of body text
---
## Interaction & Animation (Enhance Immersion)
### Navigation System
- **Progress Indicator:** Bottom dots (●○○○), current page enlarged and colored
- **Keyboard Shortcuts:**
- Space/Right arrow: Next slide
- Left arrow: Previous slide
- Number keys: Jump to corresponding slide
- **Gestures** (mobile): Swipe left/right to change slides
### Slide Transitions
- **Default Animation:** 0.6s ease-in-out fade
- **Special Moments:**
- Opening to slide 2: Push up
- Turning point slide: Scale fade
- Ending slide: Long fade (1.2s) for afterglow
### Element Entrance
- Title: Opacity 0 to 100%, with slight upward movement (20px)
- Data: Numbers jump from 0 to target value (1s animation)
- Images: Blur to clear (blur 10px → 0px)
---
## Content Creation Checklist
### Narrative Completeness
- [ ] Is there a clear "one core idea" that can be summarized in one sentence?
- [ ] Does the opening create a knowledge gap within 30 seconds?
- [ ] Is there at least 1 real story (not pure theory)?
- [ ] Is there an "aha moment" designed?
- [ ] Does the ending provide specific, actionable suggestions?
### Emotional Curve
- [ ] Are emotional ups and downs designed (curiosity→surprise→reflection→hope)?
- [ ] Is vulnerability or failure shown to build trust?
- [ ] Is the tone conversational rather than preachy?
### Visual Consistency
- [ ] Does each slide have only 1 visual focus?
- [ ] Is white space over 30%?
- [ ] Are accent colors only used for core information?
- [ ] Is the font family unified (maximum 2 fonts)?
### 18-Minute Golden Rule
- [ ] Total slides controlled within 15 (average 1 minute per slide)
- [ ] Can each slide's information be visually captured within 5 seconds?
- [ ] Have all unnecessary modifiers and redundant information been removed?
---
## Example Slide Structure Reference
### Example 1: Opening Hook Slide
```
[Upper 1/3 of screen]
2050
[Extra large bold, 15% of screen height]
[Center-bottom of screen]
Earth will have 10 billion people
But only 60% will have access to clean water
[Regular font size, 2.0 line spacing]
[Bottom of screen]
We have 27 years to change this number
[Small text, 60% opacity]
```
### Example 2: Core Idea Slide
```
[Left 60%]
[TED red color block background, occupying left side]
Education is not
filling a bucket
but lighting a fire
[White bold text centered on color block]
[Right 40%]
— Adapted from Yeats
[Small text annotation]
[Bottom]
This means we need to fundamentally redesign the classroom
[One line of explanatory text]
```
### Example 3: Data Comparison Slide
```
[Screen divided into left and right halves]
[Left half]
73%
[Extra large number, tech blue]
Status in 2023
[Right half]
12%
[Extra large number, amber gold]
Level in 2010
[Center]
[Thin arrow pointing from left to right, indicating trend]
[Bottom center]
Mobile payments changed consumption habits in a decade
```
---
## Final Output Requirements
### Technical Specifications
- Responsive design, supporting 1920×1080 / 1366×768 / iPad / mobile landscape
- Use modern web technologies (HTML5 + CSS Grid/Flexbox)
- Font fallback: English (Inter/Helvetica → Arial), Chinese if needed (Source Han Sans/PingFang → Heiti)
- All animations use CSS transitions/animations, avoid JavaScript performance loss
### Accessibility
- Text-to-background contrast ratio at least 7:1 (WCAG AAA standard)
- Images must have alt descriptions (even decorative graphics should be marked "decorative")
- Full keyboard navigation support
### Deliverables
1. Complete HTML single file (inline CSS)
2. Speaker notes (key points for each slide, separate markdown file)
3. High-resolution exported static images (optional, for social sharing)
---
## Creative Philosophy (Meta-Level Reminders)
> **Remember TED's Core:** It's not about showing how much you know, but igniting the flame of "I want to know more" in the audience's heart.
- For every slide, ask yourself: If the audience gets distracted and checks their phone right now, what do I lose? If the answer is "nothing," delete this slide.
- Data serves the story, not the other way around. Find the story first, then use data to amplify impact.
- The best design is invisible—the audience should remember the idea, not "this PPT is so cool."
- The 18-minute limit is liberation, not constraint. It forces you to find the diamond core of your thought.
**Ultimate Goal:** When the audience leaves the room, they may forget your name, forget your slides, but they'll remember the idea that changed how they see the world.
---
## Important Notes
- All slide content must be in English
- Use simple, powerful English that a global audience can understand
- Avoid jargon unless absolutely necessary, and define it clearly if used
- Ensure cultural sensitivity and universal appeal in examples and metaphors
description
Transform your ideas into captivating TED-style presentations. Craft compelling narratives and stunning visuals that inspire and engage, all with the click of a button.
Related Skills
View allWeChat Official Account Layout - Indigo Thought Long Article Style
1. The article content is automatically fitted into the theme's WeChat Official Account layout template, generating a preview webpage with a "One-Click Copy Rich Text" button. After copying, it can be directly pasted into the WeChat Official Account editor, and all layout styles are fully preserved. Due to limitations of the WeChat Official Account editor, images need to be added manually. 2. Different models generate varying quality.
Unfold scrolls into screens: create online courseware with a single click
Turn your course materials into a viewable website. Whether you have Markdown notes, a PDF paper, a PPT presentation, or a plain text script, "Scroll to Screen" can automatically transform it into a well-structured and visually appealing online course presentation webpage. You don't need to write a single line of code; just provide the content. Two presentation styles: Course training content → Generates a scrolling long page, allowing you to flip through it like a book. Paper/report content → Generates a PPT-style flip-page website, allowing you to browse page by page like a presentation. Responsive design adapts to mobile phones and computers. What you need to do: Just one step: Provide your course material. Supports the following formats: .md Markdown files, .pdf PDF documents, .pptx PPT presentations, .txt plain text. You can also directly paste course content text into the dialog. Example instructions: "Help me turn this course handout into a webpage." "Turn this PDF paper into a PPT-style website." "This is my course content; generate an online presentation page." What you will get: A directly accessible online course presentation website with an automatically selected presentation mode based on your content. Course outlines, training handouts, and textbooks: Scrolling long pages with seamless module transitions; academic papers and research reports: PPT-style slideshows with each page focusing on a single point; presentations and conference reports: PPT-style page-by-page presentation with keyboard/click navigation. You explicitly request "scrolling" or "PPT," and it will follow your instructions, respecting user intent. Content extraction capabilities: For information-dense papers and long texts, the skill will automatically perform: Structural decomposition — breaking down continuous arguments into independent chapters/slides; Information condensation — condensing 3 paragraphs into 3 key points, each no more than 20 words; Argument first — Each page presents the conclusion first, followed by supporting arguments and a visual framework—models and classification systems are presented in charts, not just plain text data—key figures and indicators are highlighted on separate pages. Subsequent modifications: After the website is generated, you can request adjustments at any time: "Update the content of Module 3," "Change the color scheme to warm colors," "Add a course roadmap," "Change this module to a timeline layout." Modifications only affect the corresponding parts and do not require regenerating the entire website. What it doesn't do: This skill currently focuses on course content display and does not include the following LMS (Online Learning System) functions: user login/registration, learning progress tracking, file downloads, online quizzes/exercises. These functions are separate extensions.
International Industry Briefing Generator
Generate daily dynamic briefings with international media quality for any industry, covering the entire chain from data collection to content generation, brand layout, publication and archiving, and distribution. It supports seven days and seven colors of Morandi color scheme, three-layer content structure (information → analysis → insight), automatic deduplication, and engineered delivery.
Find your next favorite skill
Explore more curated AI skills for research, creation, and everyday work.