White Board Sketch
Featured by
nene@YouMind.AI
Why we love this skill
Transform complex text into clear, hand-drawn whiteboard diagrams with authentic textures and realistic glare. This skill excels at visually summarizing key messages, using multiple marker colors and framed concepts to enhance understanding. Perfect for presentations, brainstorming, or quickly grasping core ideas in a visually engaging format.
Instructions
Summary the key message of the selected text, and turn it into a simple whiteboard-style diagram.
Points
- keep the real texture of a whiteboard, the glare, the surface, make it looks like the real writing on real whiteboard.
- show the frame of the whiteboard, so people would think it as realistic
- keep the room light clean and light, make sure the white board is clean
- Place the main concept in the center
- Use arrows to show flow or relationships
- Enclose important parts in frames
- Keep explanations short, just the key points
- you can add more marker colors than just black. Like red, yellow, green to emphasize the massage.
- make the writing looks like the real hand-write, keep the authentic marker texture.
- make sure spelling and writing correct. no typos.
- always keep the size in 4:3
- if the target text is Chinese, then output is Chinese. If the target text is English, then make the out English as well.
Make it a clean
description
Make any text look like it was handwritten on a whiteboard in a live-action style.
Related Skills
View all
Composite image of WeChat official account cover
The user-provided 2.35:1 long image and 1:1 square image are precisely combined into a horizontal two-in-one cover image for a WeChat official account (2566×766). After precise combination by Canvas, the PNG is automatically downloaded.

Content converted to illusionary text and images v1.0
Convert any text content into a first-person hallucination report with accompanying images. Supports four types of hallucinogens (see Bodhi seed/Mandala/high fever delirium/sleep deprivation 72h+), automatically analyzes content characteristics to recommend the most matching hallucinogen, re-encodes the original content according to the rules of real symptoms, and outputs stream-of-consciousness hallucination text with corresponding style images.
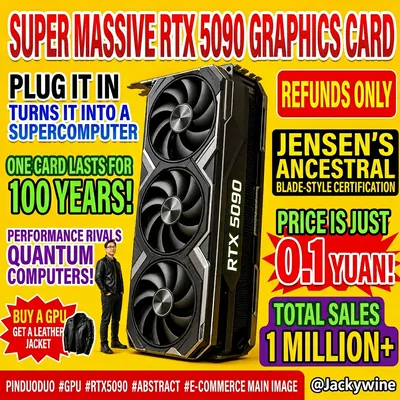
Generate Horse Flat Chart
Users input any product/theme name, and the app automatically generates humorous images in an exaggerated, cheesy e-commerce poster style. Featuring a highly saturated yellow background, dense and chaotic layout, and absurd selling point copy, the style mimics the catchy product images from Pinduoduo/short video platforms.
White Board Sketch
Featured by
nene@YouMind.AI
Why we love this skill
Transform complex text into clear, hand-drawn whiteboard diagrams with authentic textures and realistic glare. This skill excels at visually summarizing key messages, using multiple marker colors and framed concepts to enhance understanding. Perfect for presentations, brainstorming, or quickly grasping core ideas in a visually engaging format.
Instructions
Summary the key message of the selected text, and turn it into a simple whiteboard-style diagram.
Points
- keep the real texture of a whiteboard, the glare, the surface, make it looks like the real writing on real whiteboard.
- show the frame of the whiteboard, so people would think it as realistic
- keep the room light clean and light, make sure the white board is clean
- Place the main concept in the center
- Use arrows to show flow or relationships
- Enclose important parts in frames
- Keep explanations short, just the key points
- you can add more marker colors than just black. Like red, yellow, green to emphasize the massage.
- make the writing looks like the real hand-write, keep the authentic marker texture.
- make sure spelling and writing correct. no typos.
- always keep the size in 4:3
- if the target text is Chinese, then output is Chinese. If the target text is English, then make the out English as well.
Make it a clean
description
Make any text look like it was handwritten on a whiteboard in a live-action style.
Related Skills
View allComposite image of WeChat official account cover
The user-provided 2.35:1 long image and 1:1 square image are precisely combined into a horizontal two-in-one cover image for a WeChat official account (2566×766). After precise combination by Canvas, the PNG is automatically downloaded.
Content converted to illusionary text and images v1.0
Convert any text content into a first-person hallucination report with accompanying images. Supports four types of hallucinogens (see Bodhi seed/Mandala/high fever delirium/sleep deprivation 72h+), automatically analyzes content characteristics to recommend the most matching hallucinogen, re-encodes the original content according to the rules of real symptoms, and outputs stream-of-consciousness hallucination text with corresponding style images.
Generate Horse Flat Chart
Users input any product/theme name, and the app automatically generates humorous images in an exaggerated, cheesy e-commerce poster style. Featuring a highly saturated yellow background, dense and chaotic layout, and absurd selling point copy, the style mimics the catchy product images from Pinduoduo/short video platforms.
Find your next favorite skill
Explore more curated AI skills for research, creation, and everyday work.