
Data Story Narrator
Turn any chart into a story people remember
Data Story Narrator
Turn any chart into a story people remember
Showcase
Description
Most charts are shown, not explained. This Skill takes a chart, a table, or a spreadsheet and turns it into a five-slide story that answers the question every audience is silently asking: so what does this mean? Give it a screenshot, a pasted CSV, or the file itself. It reads the data first — unit, period, series, missing values — and tells you plainly what the numbers are saying, so nothing downstream rests on a misread axis. Then it finds the one takeaway the data can actually defend and drafts five acts: the claim, the context that makes the number judgeable, the evidence, the mechanism behind it, and the decision it implies. You see those five headlines before any design happens, so the argument can change in a single read. Approve it, and it builds the deck: five slides, one message each, annotated charts, and speaker notes carrying the nuance the slide leaves out. The discipline is the product. No invented figures, no borrowed benchmarks, no confident causes where the data only shows a pattern — explanations arrive labelled as hypotheses, with the check that would confirm them. Headlines are sentences with a verb, never labels like “Revenue Trends”. When a claim is weak, the claim gets smaller; the evidence is never stretched. Ask in Turkish, German, or Japanese and the deck comes back in that language, down to the axis labels, decimal separators, and date formats — a story told in your audience's own language is the one they actually follow. Built for anyone who has to stand in front of a number and make it mean something: analysts, founders, product leads, consultants, and the person with fifteen minutes to turn last quarter into a decision.
Best for
Analysts, founders, product leads, consultants, and anyone turning data into a clear presentation and decision.
How to use this Skill
Provide your input
Provide a chart, table, CSV, spreadsheet, PDF, screenshot, or a metric series with any relevant context.
Run the Skill
The Skill verifies the data, identifies a defensible takeaway, and develops it into a five-slide narrative with annotated charts and speaker notes.
Review your result
Receive a concise data read-back and an audience-ready five-slide presentation with one message per slide, caveats, and a clear decision implication.
Related Skills
View all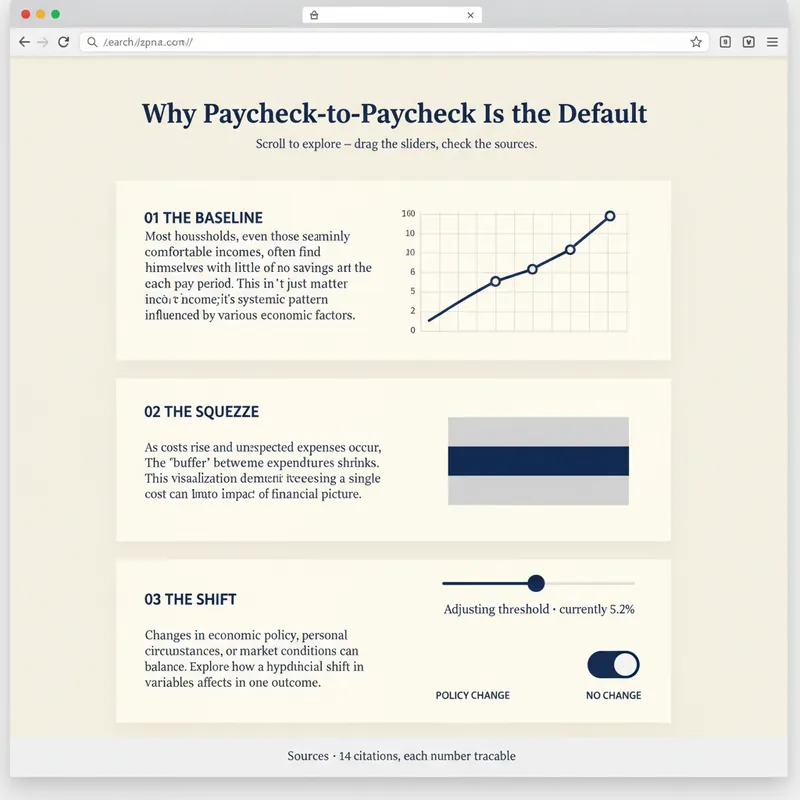 Webpage
Explorable Explainer Page Builder
A report explains. A page lets people find out for themselves. YouMind can already build webpages. Explorable Explainer decides what to build — it turns a piece of research, a dataset or a topic into a single interactive page in the tradition of newsroom graphics and explorable explanations: scroll-driven narrative, real charts, controls you can move, sources you can check. It plans before it codes. You approve a build plan first: the one question the page answers, the reveal — the moment the reader should feel "oh" — a five to eight section scroll spine, two to four interactions each justified by what the reader learns from moving it, and a data contract listing every number and where it came from. Then it builds one self-contained HTML file with no build step. Semantic markup. All numbers in a single editable DATA constant at the top. Scroll reveals that do not break on a phone. Every control a real, keyboard-operable form element with live text describing its current value. Accessibility is built in rather than bolted on: 4.5:1 contrast, visible focus rings, alt text everywhere, no meaning carried by colour alone, reduced-motion respected, responsive from 360px. Before handing over, it runs a five-point self-review and reports the results honestly: does the reveal actually land, does the page still read with JavaScript off, is the tab order sane, is every number traceable, is anything animating that a reader would want to stop. Two rules it will not break: it never invents data to make a chart look good, and it tells you when your numbers contradict your draft. For researchers, analysts, journalists, educators, indie founders and consultants who want their work to be explored rather than skimmed.
 Video
Storyboard Educational Videos
Hand it a document — a training guide, an SOP, a product brief, a course chapter — and get back a shooting plan you can film today: numbered scenes, one idea each, each with a clear visual direction, an English image prompt, spoken narration that fits the clock, and subtitles that match the voiceover word for word. Most documents are written to be read, not performed: the narration rambles, the visuals repeat the text, the subtitles drift out of sync. This Skill rebuilds the material for the screen — 3–6 observable learning objectives, a hook → orientation → teaching beats → recap → CTA arc, and a fixed time budget of 2.2 words per second per scene, so nothing gets cut later in the edit. Every plan ships with an overview, one visual style guide reused across all scenes, a scene index with exact timings, a per-scene breakdown (purpose, framing, on-screen text, English image prompt, voiceover, subtitle cues, audio), production notes and an explicit list of assumptions and content risks. How to ask for it — four shapes that work best: • Just the file: "Turn this into an educational video plan." Audience and runtime are inferred and stated as assumptions. • File + runtime + audience: "A 4-minute onboarding video for new support hires; screen recordings only, no on-camera presenter." • File + format: "A 60-second vertical 9:16 plan for LinkedIn, high tempo, one-line subtitles." • Thin or messy source: "These notes are scattered bullets — still build a 3-minute plan, mark the gaps TODO: and list your assumptions." Output language follows your message: ask in Turkish, Spanish or Japanese and the whole plan comes back in that language. Only the image prompts stay in English, ready for any image model. Built for L&D teams, course creators, product marketers and anyone handed a twelve-page PDF and told "make it a video".
 Write
One Source, Five Formats
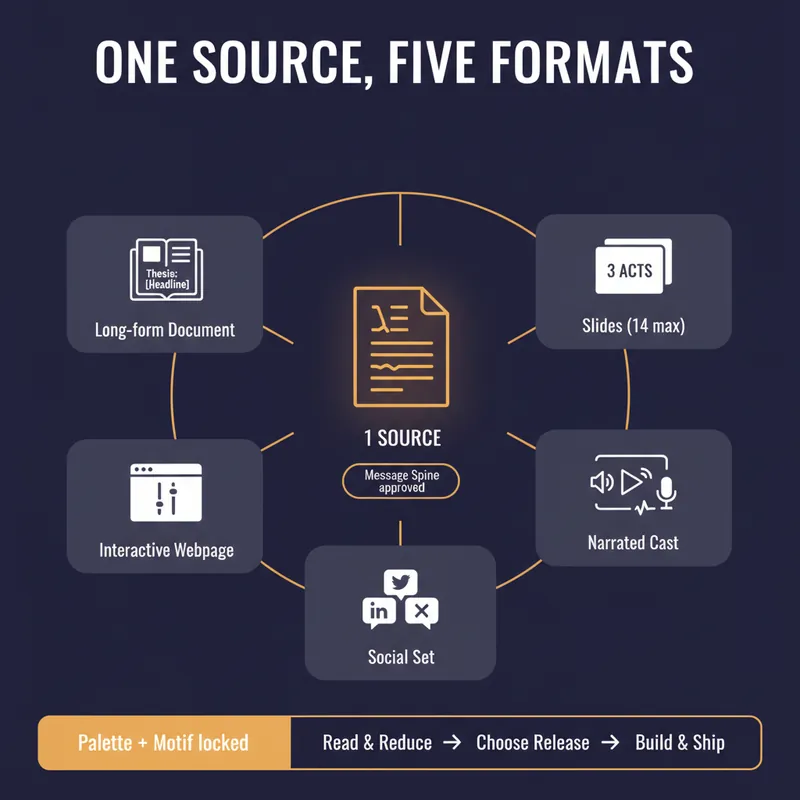
YouMind can produce a document, a slide deck, a narrated video, an interactive webpage and a set of social posts. Most people use one of them, because doing all five by hand means writing the same argument five times and watching it drift a little further each time. This skill stops the drift by refusing to start until you have a spine. Before anything is generated it writes a Message Spine: one thesis under 25 words, three load-bearing points, the single strongest piece of evidence, the one image a reader should still have tomorrow, the change you want in them, and who this is explicitly not for. You approve it. Every format is then built from the spine, never from the previous format, so nothing compounds an earlier compromise. Then it tells you which formats are actually worth making. A short reflective essay makes bad slides. A dense data teardown makes bad audio. It will recommend two formats and explain why the other three would weaken the work, which is the opposite of what a content-multiplier is supposed to say. Each format gets built to its own rules, one at a time, with your confirmation. Slides get one idea per slide and speaker notes that carry the argument. The cast script is written for the ear, with numbers rounded and given a comparison and a deliberate pause before the strongest evidence. The webpage gets exactly one interactive move the flat text could not do. The social set opens each post on a different point so it does not read as three copies of itself, and every post gives away something real instead of begging for a click. One palette, one type treatment, one recurring motif, decided in writing before the first image is generated. You finish with a ship sheet: what goes where, in what order, how many days apart, with what call to action, and the one signal to watch. Plus a consistency check that quotes the thesis sentence from every format and confirms they still agree. It estimates credits before it spends them and never renders a full cast or image set without an explicit yes.
Information
- Version
- v4
- Last updated
- Runtime credits
- Usage-based
- Models
- Auto
- Use cases
- Presentations & reportingResearch & analysisBusiness & strategy
- What you get
- ReportSlides