Data Visualization
Data Visualization
Showcase
Description
Generates visual charts that adhere to the Storytelling with Data (SWD) principles based on user-provided data. Trigger conditions: This skill must be used when users provide data and request to "draw", "generate charts", "visualize", "make a chart", "show me this data", or upload CSV/Excel/table data and want a graphical representation. Even if users only say "help me analyze this data" and the data is suitable for visualization, this skill should be actively used to generate charts.
Recommended by
nene@YouMind
Why we love this skill
This skill is based on the six principles of data storytelling. It intelligently selects chart types based on user needs and offers diverse visual styles such as professional business, social media, and hand-drawn. Whether generating high-quality images or interactive HTML charts, it helps you turn data into insightful stories, making complex numbers clear at a glance.
Related Skills
View all
9D Visual Deconstruction
Break down one or more infographics, data visualizations, flowcharts, timelines, maps, knowledge graphs, and organizational charts into reusable visual and information structures. Understand precisely why an image is organized the way it is and reconstruct a similar communicative effect. The skill examines spatial composition, dimensionality and materials, color hierarchy, typography and layout, and module relationships, while also identifying chart encodings, reading paths, visual-symbol metaphors, and geographic or network relationships—so the analysis goes beyond simply describing what the style resembles. You will receive a parameterized visual deconstruction covering the canvas and compositional logic, visual hierarchy, text density, module topology, ways of expressing data and relationships, and the narrative flow within the image. For statistical charts, maps, and relationship networks, the output focuses on how data is mapped to visual variables such as color, position, size, connecting lines, and nodes. For complex subject-specific visuals, it further organizes the coordinated relationships among graphics, text, and metaphor systems. Based on this analysis, the skill generates detailed, clearly structured English image-generation prompts suitable for infographic recreation, visual research, design reference, brand content exploration, and concept development. Whether you provide an existing image or an idea for a theme and visual direction, you will receive prompts aimed at reproducing the underlying structure—not just a vague description of the style.
 Image
SENSUS Daily Aesthetic Lesson
This skill is designed to combine user-provided images with an aesthetic principle, deeply analyze their visual composition, and transform that analysis into prompt templates and practice cases usable by AI image generation tools. It is suitable for designers, artists, content creators, and any user who wants to improve their visual literacy and master AI image generation techniques. With this skill, users can submit images and specify an aesthetic theme, or let the AI deduce one from the image content. The skill will perform a detailed analysis of the image from multiple dimensions such as composition, color, mood, and technique, centered around the chosen theme. Then, based on the analysis, it generates a set of AI prompt templates that include English and Chinese explanations and variable descriptions, helping users understand how to translate abstract aesthetic principles into concrete AI instructions. Additionally, the skill uses AI image generation to create new practice case images based on those templates, and provides a detailed review that highlights the accuracy and deviations of the AI execution, along with specific adjustment suggestions. Finally, all analysis and generated content is presented in a well-structured, professional "Aesthetic Deep Dive" document, helping users deepen their understanding of visual aesthetics and master practical methods for applying aesthetic concepts to AI creation.
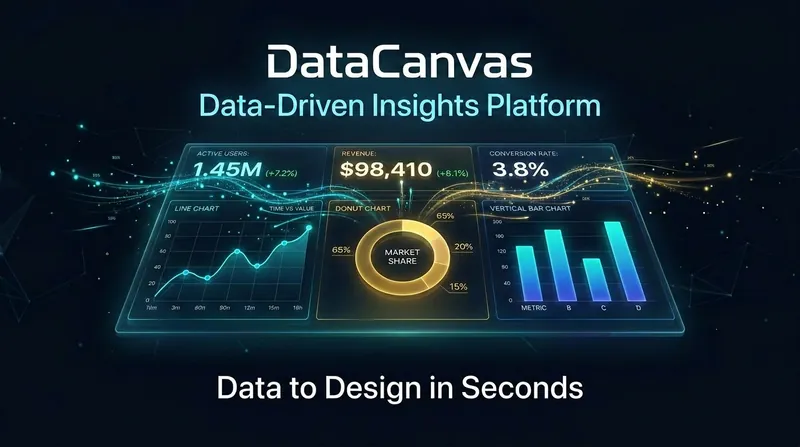
DataCanvas
Data speaks for itself; it just needs a stage. DataCanvas automatically transforms your CSV/Excel/JSON data into professional-grade visual analysis reports. Inspired by the anti-AI aesthetic philosophy of the 11k-star project huashu-design (banning purple gradients, emoji decorations, and bento grids), all charts are hand-coded in pure SVG without relying on any external JS libraries. It includes 6 report templates (Daily/Weekly Operations, Competitor Comparison, User Profiles, Investment Analysis, Free Report) x 5 design styles (Information Architecture, Oriental Minimalism, Swiss Grid, Dark Data, Business Classic), supporting over 20 chart types. From data upload to polished report, everything is automated: data cleaning, statistical analysis, trend insights, chart generation — all in one go.
Information
- Version
- v1
- Last updated
- Runtime credits
- Usage-based
- Models
- Auto