
Image Table to Excel
Snap a table, turn it into a spreadsheet
Image Table to Excel
Snap a table, turn it into a spreadsheet
Showcase
Description
Paper tables, tables in screenshots, or tables in PDFs usually mean manual retyping. Image Table to Excel recognizes headers, merged cells, and units, outputting a table you can paste directly into Excel while marking cells that need review. Hard rules: raw data is not modified; amounts and dates prompt for cell-by-cell verification; merged cell handling is explained.
Best for
Users who need to convert paper tables, screenshots, or PDF tables into structured data that can be pasted into Excel.
How to use this Skill
Provide your input
Provide a table image and specify the approximate rows, columns, and format requirements; you can also mention merged cells, units, and whether summary formulas are needed.
Run the Skill
The tool organizes the table in the image into structured data, preserves the original values, explains how merged cells were handled, and flags content that requires manual verification.
Review your result
Returns a viewable Markdown table, a CSV file ready for Excel import, and a verification checklist; common summary formulas can be included if needed.
Related Skills
View all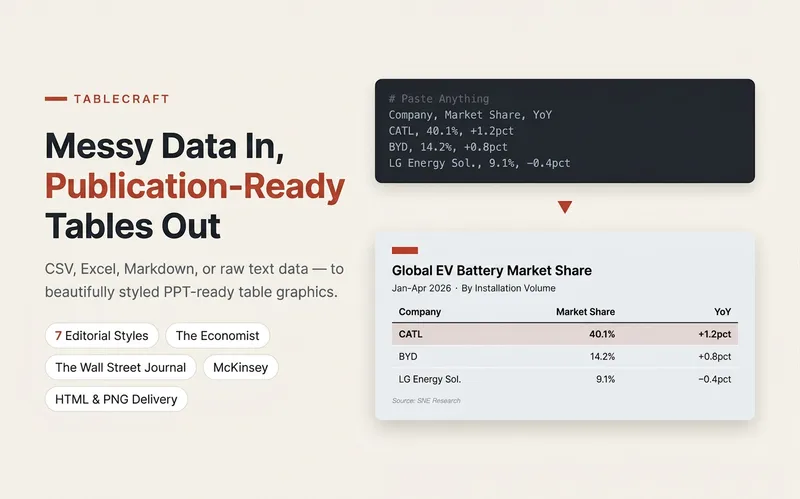 Slides
TableCraft
Turn CSV, JSON, Markdown tables, or pasted cells into clear, editable HTML tables. Ideal for comparing pricing plans, selecting tools, and preparing team weekly reports, with support for seven preset styles and brand colors. Preserve currencies, units, billing cycles, number precision, and sources; missing values stay missing—no filling with 0 or guessing prices. Calculate and verify totals only when conditions allow; flag discrepancies without changing numbers. Split wide tables into column-group pages and repeat key columns; repeat headers for long tables. Never silently remove columns or abbreviate content. A first version is created by default. When the environment supports actual rendering and export, a PNG is also provided; otherwise, complete HTML is provided with an explanation that it was not exported. Try it directly: compare three subscription tiers, organize tool-selection materials, or polish an eight-column team weekly report. For chart-based infographics, use Infographic Maker; for text carousels, use a knowledge card generator.
 Video
Star-Trail Data Video Generator
Transform ranking changes from your spreadsheets into video highlights. From national GDP shifts and store revenue competition to brand sales fluctuations, watch them unfold across stars, light trails, and camera movements. Upload a standard Excel or CSV file, tell it what metric you want to showcase, and let the skill handle the rest: - Bring data to life: Dynamic star cores, colorful light trails, and multi-layered cosmic backgrounds. - Impactful overtaking: Real position changes trigger expansion halos, light bursts, and sudden flares. - Rhythm-driven camera work: Automatic tracking, angle shifts, and staggered entrances and exits. - Fact-based accuracy: Automatically calculates rankings, preserves ties and missing data, ensuring every shift is backed by data. No need to prefill rankings, trajectories, or camera parameters. Duration adjusts automatically to your data up to a default 240 seconds, outputting a 1080p silent MP4.
Smart Expense Tracker
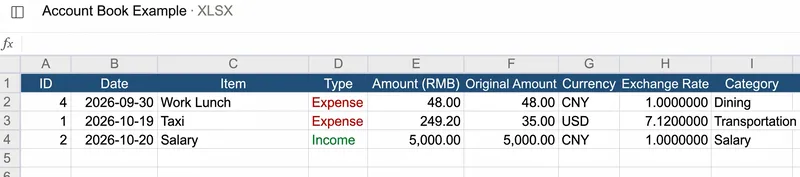
Personal expense tracker (Excel). When you send a message or screenshot (payment record, bill, invoice, transfer, or receipt) and specify whether it is an expense or income, the Skill extracts the date, item, amount, and currency, converts everything into RMB, and records it in an Excel ledger (记账本.xlsx). You can continuously add entries, or ask to delete or modify specific records, and generate a monthly summary. Whenever you mention bookkeeping, recording a transaction, a ledger, bills, spending amounts, income, expenses, deleting a record, a monthly summary, a monthly report, or foreign currency conversion to RMB, this Skill will be used even if you do not explicitly say "track expense".
Information
- Version
- v2
- Last updated
- Runtime credits
- Usage-based
- Models
- Auto
- What you get
- Data