3D Paper-Cut Science Diagram
Featured by
nene@YouMind.AI
Why we love this skill
This skill transforms knowledge into 3D paper-cut illustrations, making learning engaging. Whether showing processes, comparisons, or classifications, it uses a unique artistic style, perfect for educational and science content. Its warm tones and handcrafted texture offer an immersive visual experience.
Instructions
## How to use
Upload an article or enter keywords to automatically generate 3D paper-cut style educational science illustrations.
## Command Format
plaintext
@3D Paper-cutting Science Illustrations [Theme] [Type]
```
**Type Options:**
- `Flowchart` - Displays the process steps (default)
- `Comparison Type` - Balance Scale Comparison Structure
- Classification - Grid-based classification display
## Example Usage
- `@3D Paper-cut Science Illustration: Coffee Brewing Process`
- `@3D Paper-cut Science Illustration: Tea Fermentation Comparison`
- `@3D Paper-cutting Science Illustration Chocolate Making`
---
## Core Keyword Template
### Basic Framework
plaintext
Educational infographic in 3D paper cut art style with beige/cream background.
Title: "[Main Title]"
Subtitle: "[Subtitle Description]"
Content sections:
- Top section: [Top content] with icons in paper cut style
- Middle section: [Core content]
- Bottom section: [Supplementary information at the bottom]
All elements in layered 3D paper cut art style with soft shadows, warm color palette (beige, brown, cream, soft pastels), educational and handcrafted aesthetic.
```
### Template 1 - Process Type
plaintext
Educational infographic in 3D paper cut art style. Title "[Topic]" at top. Step-by-step process shown with numbered paper cut elements: 1) [Step 1], 2) [Step 2], 3) [Step 3]. Each step has icon and description. Arrows connecting steps. Beige background, dimensional paper layers, handcrafted aesthetic.
```
### Template 2 - Comparison Type (Balance Scale Structure)
plaintext
Educational infographic in 3D paper cut art style. Title "[Topic Name]" at top. Central vintage balance scale showing comparison between [A] and [B]. Top section with 3-4 icons (thermometer, clock, [related icon]) with text labels. Bottom section with key points and circular badges. Beige background, layered paper effect, soft shadows, warm tones.
```
### Template 3 - By Type
plaintext
Educational infographic in 3D paper cut art style. Title "[Topic]" at top. Multiple categories arranged in grid: [Category 1], [Category 2], [Category 3], each with icon and key information. Bottom summary section. Warm color palette, layered paper craft, soft shadows, cream background.
```
---
## Key Style Elements
**Essential Keywords:**
- 3D paper cut art style
- `layered paper craft technique`
- `beige/cream background`
- `soft shadows between layers`
- dimensional depth
- Handcrafted aesthetic
- `warm color palette`
**Common Icon Elements:**
- Thermometer: `thermometer icon in layered paper`
- Clock: `clock icon with paper layers`
- Balance: `vintage balance scale made in paper art`
- Container: `container in paper craft style`
- Tags: `banner / label with text`
- Circular badge: `circular badge / emblem in paper cut`
---
## Theme Replacement Guide
| Element | Example Replacement |
| --- | --- |
| **Topics** | Coffee brewing, tea fermentation, chocolate making, bread baking |
| **Core Concepts** | pH value → Temperature, time, ratio |
| **Icons** | Thermometer → Coffee Cup, Teapot, Oven |
| **Values** | 4.1-4.3 → 92°C-96°C |
| **Comparison Items** | Acidity/Intensity → Bitterness/Sweetness |
---
## Generate suggestions
1. **Maintain a clear structure:** Title → Core content → Supplementary explanations
2. **Icons should be specific:** Clearly explain what each icon represents.
3. **Text must be complete:** Write the Chinese text to be displayed directly in the prompt.
4. **Emphasize Style:** Always include the keywords "3D paper cut art style" and "layered".
5. **Unified Color Scheme:** Use warm colors (beige, brown, cream, soft pastels).
---
## Common Theme Presets
### Coffee Brewing
- Steps: Grinding → Weighing → Brewing → Extraction
- Temperature: 92-96°C
- Time: 2-4 minutes
- Scale: 1:15-1:17
### Tea Fermentation
- Types: Green tea (unfermented) → Oolong tea (semi-fermented) → Black tea (fully fermented)
- Temperature: 80-100°C
- Time: 3-5 minutes
### Bread Baking
- Steps: Mixing → Kneading → Fermentation → Shaping → Baking
- Temperature: 180-220°C
- Time: 20-40 minutes
---
## Technical Specifications
- **Aspect Ratio:** 16:9 (Horizontal Science Illustration)
- **Generative Model: Nano Banana Pro**
- **Quality setting**: medium (standard quality)
- **Style Consistency**: High (Ensuring through fixed templates)
Description
Automatically generate 3D paper-cut style educational science illustrations for articles or topic keywords.
Related Skills
View all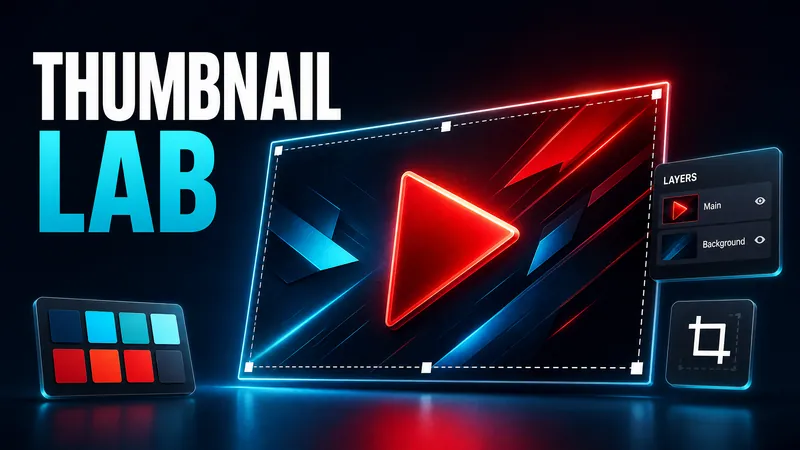 Image
ImageDesign YouTube Thumbnail
Analyzes your video topic and target audience with current trends, offers three testable concepts, and converts the chosen direction into a professional 16:9 YouTube thumbnail.
 Image
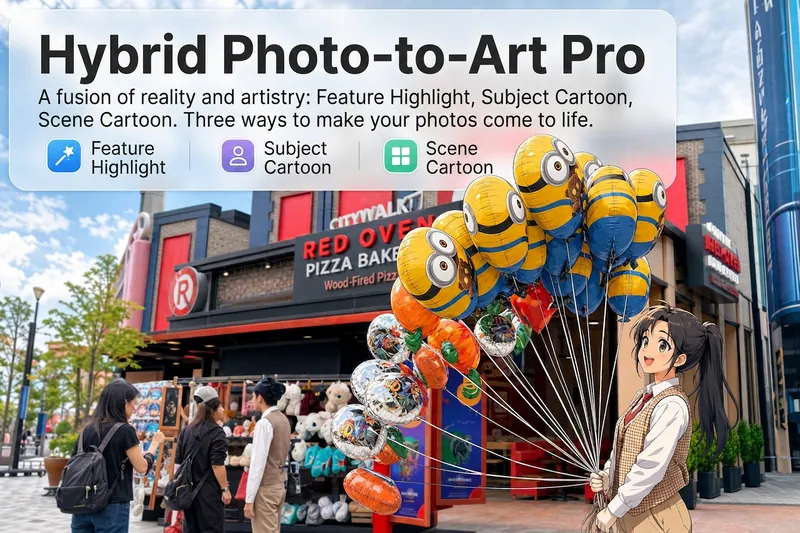
ImageHand-Drawn Artist Pro
Upload a photo, and AI analyzes it like a visual expert from five dimensions—what the subject is, composition, color tone, visual focus, and emotion conveyed. Then it tells you where hand-drawn effects would work best and how to apply them. Three modes of reality-to-art, three ways to play: 🔹 Local Highlight — The overall photo stays real, while AI selects 2-3 areas to replace with hand-drawn styles. Patterns on a sign, a coffee cup in hand, a few flowers in a bush—just accents, giving the photo a breath of life. 4 hand-drawn styles: Sketch lines / Watercolor wash / Sticker doodle / Clay relief. 🔹 Subject Cartoon — People, animals, or objects become entirely anime, while the background keeps a realistic photographic feel. 5 anime styles: Passionate Japanese manga / American superhero comics / Studio Ghibli / Korean webtoon / Chinese ink painting. The effect is like anime characters stepping into the real world. 🔹 Environment Cartoon — The reverse: the subject stays real, but the surroundings become fully anime. The contrast of a person in a 2D world, maxed out with one tap. Each mode × 2 blending methods: Gradient feathering (smooth transition between real and art, like ink spreading) / Hand-drawn border (white outline, like a sticker). No random outputs—you stay in control. AI analyzes → recommends → you confirm → then generates. No wasted images. For portraits, facial features are automatically avoided; hand-drawn replacements are limited to 2-3 areas with professional constraints on placement and size—so it's "highlighting," not "collage." 3 modes · 9 styles · 2 blending methods = 28 reality-art combinations. The same photo can yield completely different looks.
 Image
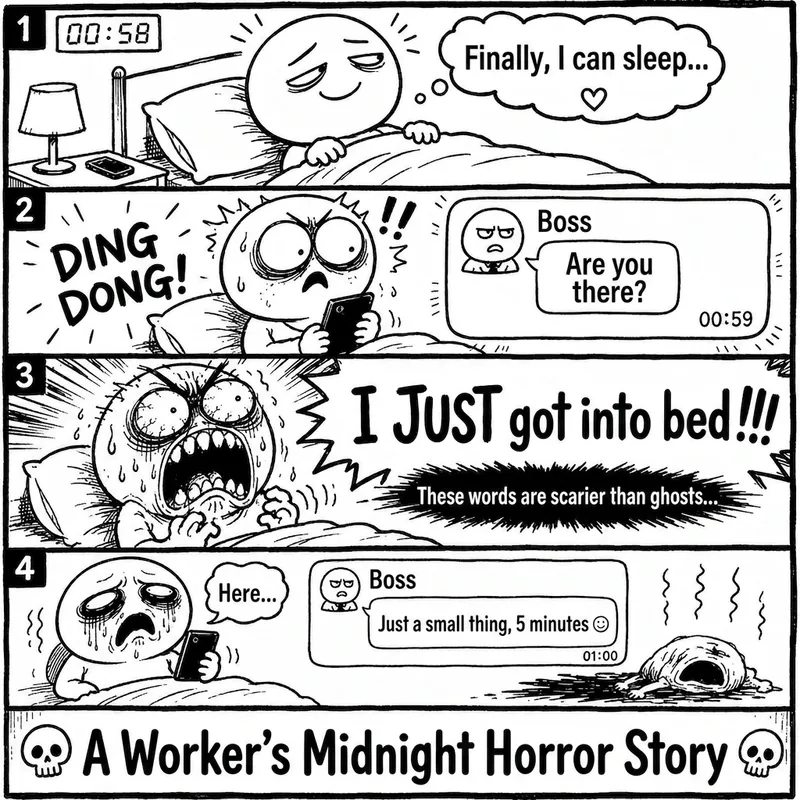
ImageRage Comic Style Image
"One-Page Rage Comic Machine" is a Skill specifically designed to generate Chinese roast comic images. You just need to input a situation, an emotion, a meme, or a phrase like "Today's me", and it will automatically expand into a complete one-page black-and-white rage comic style image. Default generation effects include: - Black-and-white line art - Exaggerated expressions - Big-headed, small-bodied comic characters - Speech bubbles and large-text roast lines - Single-panel large image or 2-4 panel short comic - Clear punchline or final zinger - Suitable for social media posting and meme sharing It is especially well-suited for high-resonance topics such as office worker rants, student meltdowns, social awkwardness, couple daily life, diet failures, waking up late, client revision requests, boss meetings, etc. The Skill does not directly copy existing rage comic pages or specific well-known meme images, but instead generates original one-page online roast comics that provide a reading experience similar to Chinese rage comics.
3D Paper-Cut Science Diagram
Featured by
nene@YouMind.AI
Why we love this skill
This skill transforms knowledge into 3D paper-cut illustrations, making learning engaging. Whether showing processes, comparisons, or classifications, it uses a unique artistic style, perfect for educational and science content. Its warm tones and handcrafted texture offer an immersive visual experience.
Instructions
## How to use
Upload an article or enter keywords to automatically generate 3D paper-cut style educational science illustrations.
## Command Format
plaintext
@3D Paper-cutting Science Illustrations [Theme] [Type]
```
**Type Options:**
- `Flowchart` - Displays the process steps (default)
- `Comparison Type` - Balance Scale Comparison Structure
- Classification - Grid-based classification display
## Example Usage
- `@3D Paper-cut Science Illustration: Coffee Brewing Process`
- `@3D Paper-cut Science Illustration: Tea Fermentation Comparison`
- `@3D Paper-cutting Science Illustration Chocolate Making`
---
## Core Keyword Template
### Basic Framework
plaintext
Educational infographic in 3D paper cut art style with beige/cream background.
Title: "[Main Title]"
Subtitle: "[Subtitle Description]"
Content sections:
- Top section: [Top content] with icons in paper cut style
- Middle section: [Core content]
- Bottom section: [Supplementary information at the bottom]
All elements in layered 3D paper cut art style with soft shadows, warm color palette (beige, brown, cream, soft pastels), educational and handcrafted aesthetic.
```
### Template 1 - Process Type
plaintext
Educational infographic in 3D paper cut art style. Title "[Topic]" at top. Step-by-step process shown with numbered paper cut elements: 1) [Step 1], 2) [Step 2], 3) [Step 3]. Each step has icon and description. Arrows connecting steps. Beige background, dimensional paper layers, handcrafted aesthetic.
```
### Template 2 - Comparison Type (Balance Scale Structure)
plaintext
Educational infographic in 3D paper cut art style. Title "[Topic Name]" at top. Central vintage balance scale showing comparison between [A] and [B]. Top section with 3-4 icons (thermometer, clock, [related icon]) with text labels. Bottom section with key points and circular badges. Beige background, layered paper effect, soft shadows, warm tones.
```
### Template 3 - By Type
plaintext
Educational infographic in 3D paper cut art style. Title "[Topic]" at top. Multiple categories arranged in grid: [Category 1], [Category 2], [Category 3], each with icon and key information. Bottom summary section. Warm color palette, layered paper craft, soft shadows, cream background.
```
---
## Key Style Elements
**Essential Keywords:**
- 3D paper cut art style
- `layered paper craft technique`
- `beige/cream background`
- `soft shadows between layers`
- dimensional depth
- Handcrafted aesthetic
- `warm color palette`
**Common Icon Elements:**
- Thermometer: `thermometer icon in layered paper`
- Clock: `clock icon with paper layers`
- Balance: `vintage balance scale made in paper art`
- Container: `container in paper craft style`
- Tags: `banner / label with text`
- Circular badge: `circular badge / emblem in paper cut`
---
## Theme Replacement Guide
| Element | Example Replacement |
| --- | --- |
| **Topics** | Coffee brewing, tea fermentation, chocolate making, bread baking |
| **Core Concepts** | pH value → Temperature, time, ratio |
| **Icons** | Thermometer → Coffee Cup, Teapot, Oven |
| **Values** | 4.1-4.3 → 92°C-96°C |
| **Comparison Items** | Acidity/Intensity → Bitterness/Sweetness |
---
## Generate suggestions
1. **Maintain a clear structure:** Title → Core content → Supplementary explanations
2. **Icons should be specific:** Clearly explain what each icon represents.
3. **Text must be complete:** Write the Chinese text to be displayed directly in the prompt.
4. **Emphasize Style:** Always include the keywords "3D paper cut art style" and "layered".
5. **Unified Color Scheme:** Use warm colors (beige, brown, cream, soft pastels).
---
## Common Theme Presets
### Coffee Brewing
- Steps: Grinding → Weighing → Brewing → Extraction
- Temperature: 92-96°C
- Time: 2-4 minutes
- Scale: 1:15-1:17
### Tea Fermentation
- Types: Green tea (unfermented) → Oolong tea (semi-fermented) → Black tea (fully fermented)
- Temperature: 80-100°C
- Time: 3-5 minutes
### Bread Baking
- Steps: Mixing → Kneading → Fermentation → Shaping → Baking
- Temperature: 180-220°C
- Time: 20-40 minutes
---
## Technical Specifications
- **Aspect Ratio:** 16:9 (Horizontal Science Illustration)
- **Generative Model: Nano Banana Pro**
- **Quality setting**: medium (standard quality)
- **Style Consistency**: High (Ensuring through fixed templates)
Description
Automatically generate 3D paper-cut style educational science illustrations for articles or topic keywords.
Related Skills
View allImageDesign YouTube Thumbnail
Analyzes your video topic and target audience with current trends, offers three testable concepts, and converts the chosen direction into a professional 16:9 YouTube thumbnail.
ImageHand-Drawn Artist Pro
Upload a photo, and AI analyzes it like a visual expert from five dimensions—what the subject is, composition, color tone, visual focus, and emotion conveyed. Then it tells you where hand-drawn effects would work best and how to apply them. Three modes of reality-to-art, three ways to play: 🔹 Local Highlight — The overall photo stays real, while AI selects 2-3 areas to replace with hand-drawn styles. Patterns on a sign, a coffee cup in hand, a few flowers in a bush—just accents, giving the photo a breath of life. 4 hand-drawn styles: Sketch lines / Watercolor wash / Sticker doodle / Clay relief. 🔹 Subject Cartoon — People, animals, or objects become entirely anime, while the background keeps a realistic photographic feel. 5 anime styles: Passionate Japanese manga / American superhero comics / Studio Ghibli / Korean webtoon / Chinese ink painting. The effect is like anime characters stepping into the real world. 🔹 Environment Cartoon — The reverse: the subject stays real, but the surroundings become fully anime. The contrast of a person in a 2D world, maxed out with one tap. Each mode × 2 blending methods: Gradient feathering (smooth transition between real and art, like ink spreading) / Hand-drawn border (white outline, like a sticker). No random outputs—you stay in control. AI analyzes → recommends → you confirm → then generates. No wasted images. For portraits, facial features are automatically avoided; hand-drawn replacements are limited to 2-3 areas with professional constraints on placement and size—so it's "highlighting," not "collage." 3 modes · 9 styles · 2 blending methods = 28 reality-art combinations. The same photo can yield completely different looks.
ImageRage Comic Style Image
"One-Page Rage Comic Machine" is a Skill specifically designed to generate Chinese roast comic images. You just need to input a situation, an emotion, a meme, or a phrase like "Today's me", and it will automatically expand into a complete one-page black-and-white rage comic style image. Default generation effects include: - Black-and-white line art - Exaggerated expressions - Big-headed, small-bodied comic characters - Speech bubbles and large-text roast lines - Single-panel large image or 2-4 panel short comic - Clear punchline or final zinger - Suitable for social media posting and meme sharing It is especially well-suited for high-resonance topics such as office worker rants, student meltdowns, social awkwardness, couple daily life, diet failures, waking up late, client revision requests, boss meetings, etc. The Skill does not directly copy existing rage comic pages or specific well-known meme images, but instead generates original one-page online roast comics that provide a reading experience similar to Chinese rage comics.
Find your next favorite skill
Explore more curated AI skills for research, creation, and everyday work.