Academic Poster Creation
Academic Poster Creation
Showcase
Description
Transform an academic paper PDF end-to-end into an A0 portrait academic poster image. AI adaptively determines the visual style, information density, and color scheme, identifies the paper's "featured anchor points" and presents them prominently. It redraws schematic diagrams, preserves original data charts, and for evidence-based visuals (UI screenshots/chat screenshots), redraws them as UI mockups with a "schematic" label when extraction is not possible. It also identifies and filters out informal layout identifiers such as temporary page numbers from online-first publications. Finally, GPT Image 2 generates a high-quality poster ready for printing and display.
Why we love this skill
This skill intelligently transforms academic papers into high-quality A0 posters. Its unique 'featured anchor identification' and 'chart triage' mechanisms ensure the poster is both rigorous and visually appealing, making it a powerful assistant for academic dissemination.
Related Skills
View all
LaTeX Research Poster Maker
Organize papers, experimental results, or research abstracts into professional LaTeX research posters suitable for conference presentations, balancing information delivery, visual hierarchy, and practical printing requirements. Whether for academic conferences, workshops, thesis defenses, or public research showcases, you can build a clear, readable poster structure tailored to dimensions like A0, A1, or 36×48 inches in both portrait and landscape formats. It supports creating traditional, modern, or multi-column layouts using beamerposter, tikzposter, and baposter. It logically organizes titles, research backgrounds, methods, results, conclusions, references, and acknowledgments, while integrating images, tables, formulas, charts, institutional logos, and QR codes. For complex research, it prioritizes core information, transforming flowcharts, methodology diagrams, and key findings into concise, striking visual elements suitable for long-distance reading. The output focuses on font sizes, color contrast, accessibility, image resolution, white space, column spacing, and page margins to help minimize cluttered content, text overflow, and print blurring. You will receive compile-ready LaTeX poster templates and high-quality PDF production advice, ideal for experimental research, computational modeling, literature reviews, and interdisciplinary scientific communication.
 Image
Research Paper Infographic
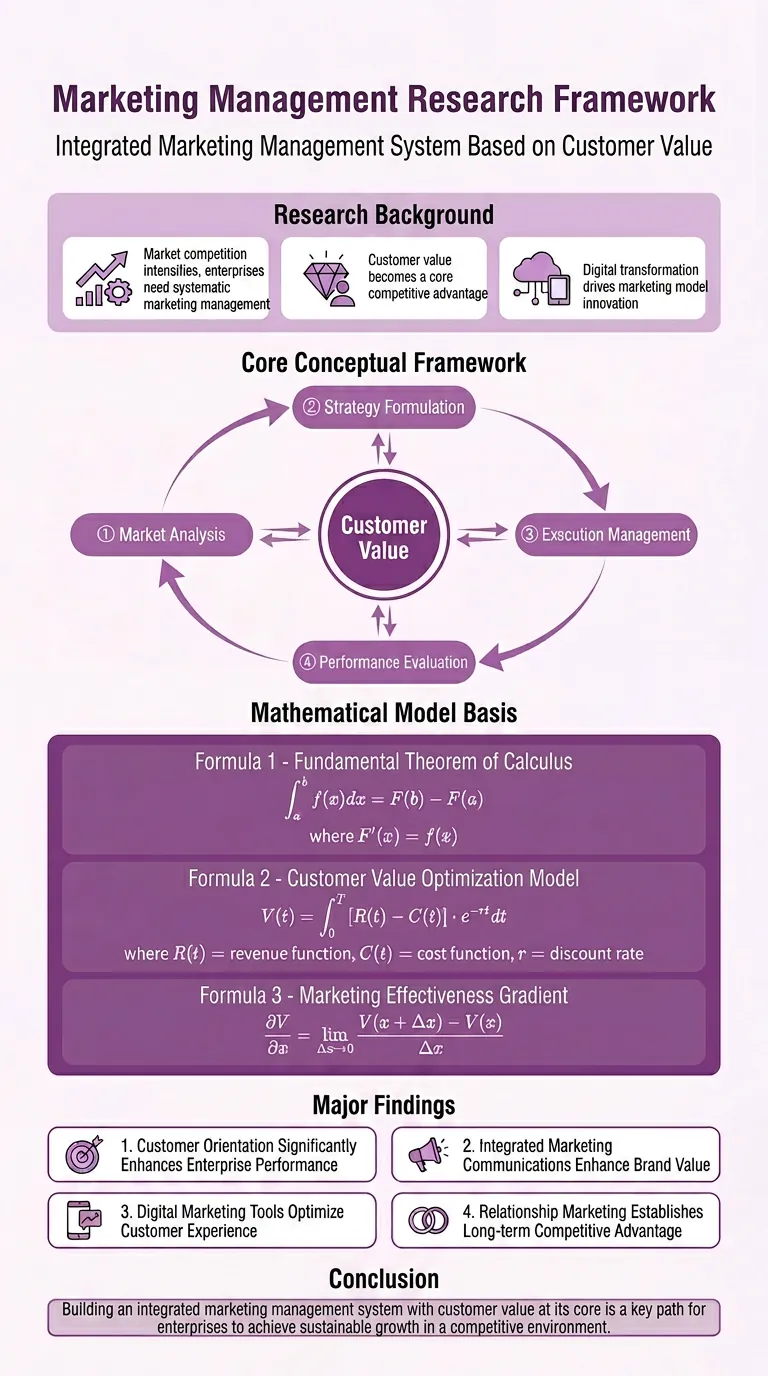
Easily transform your scientific research paper content into professional, high-definition academic infographics. Supports 18 mainstream types, making complex research results clear at a glance. Whether showcasing core mechanisms, experimental workflows, or creating graphical abstracts and technical roadmaps, this tool delivers precise results. We understand the rigor required in scientific illustrations, so beyond visual appeal, we prioritize scientific accuracy to ensure every image is clear and free of misleading information. You can directly provide the full paper, key sections, or a research description, and select the most suitable graph type, such as intracellular mechanism diagrams, tumor immune microenvironment diagrams, material catalysis mechanism diagrams, etc. We also offer a variety of color schemes like blue-green, orange, purple, and chart structure styles like left-label and vertical flow, making your infographics both academically compliant and professionally aesthetic. Beyond traditional academic graph types, this tool also supports 15 creative templates for scientific visualization scenarios, helping you turn research concepts into unique visual works such as magazine-quality posters, interface breakdowns, app design boards, etc., suitable for group meetings, social media, or report covers. We provide a strict controllability checklist and a three-step verification process, and support partial modifications to generated images, ensuring every step closely matches your needs, presenting your research results in the most intuitive and accurate way.
 Image
Infographic Poster Generator
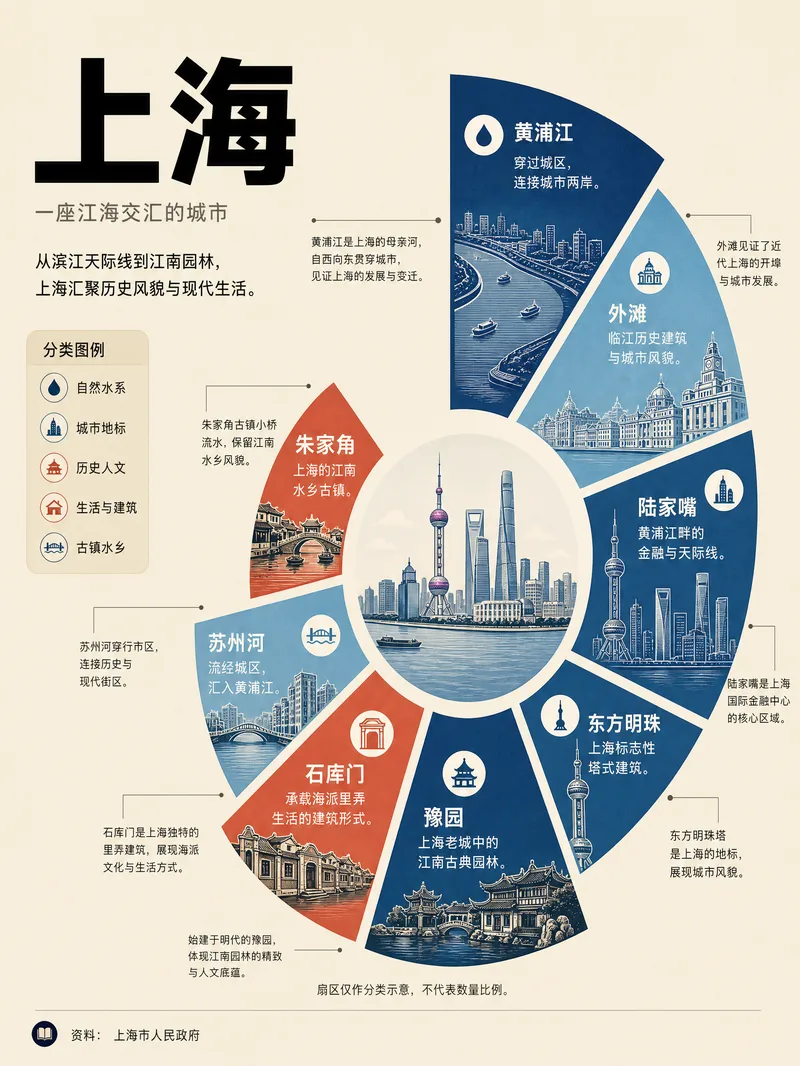
Organize a topic into an infographic poster that combines verifiable sources with visual storytelling. It is well-suited for content that requires categorization, comparison, or relationship mapping, such as natural science, history and culture, social issues, product knowledge, and complex concepts, allowing readers to quickly grasp the full picture through a clear layout. The poster defaults to a vertical Chinese format, establishing a reading entry point with a prominent top-left title and introduction, complemented by a large right-shifted radial infographic, a central theme image, classification legends, peripheral annotations, and bottom source information to create an editorial reading flow. It maintains ample whitespace and a clear information hierarchy while adapting color schemes, illustrations, and icon styles to suit the theme, avoiding content clutter or overly distracting decoration. When dealing with facts, statistics, rankings, and other verifiable information, it checks numbers, units, and dates against reliable sources and briefly notes the sources on the poster. When reliable data is available, it uses appropriate graphical expressions; when comparable data is absent, it clearly states that the sectors are for classification purposes only and do not imply proportional relationships. You can also specify the language, aspect ratio, or other visual requirements to ultimately receive a ready-to-use infographic poster rather than just a concept or generation prompt.
Information
- Version
- v6
- Last updated
- Runtime credits
- Usage-based
- Models
- Auto