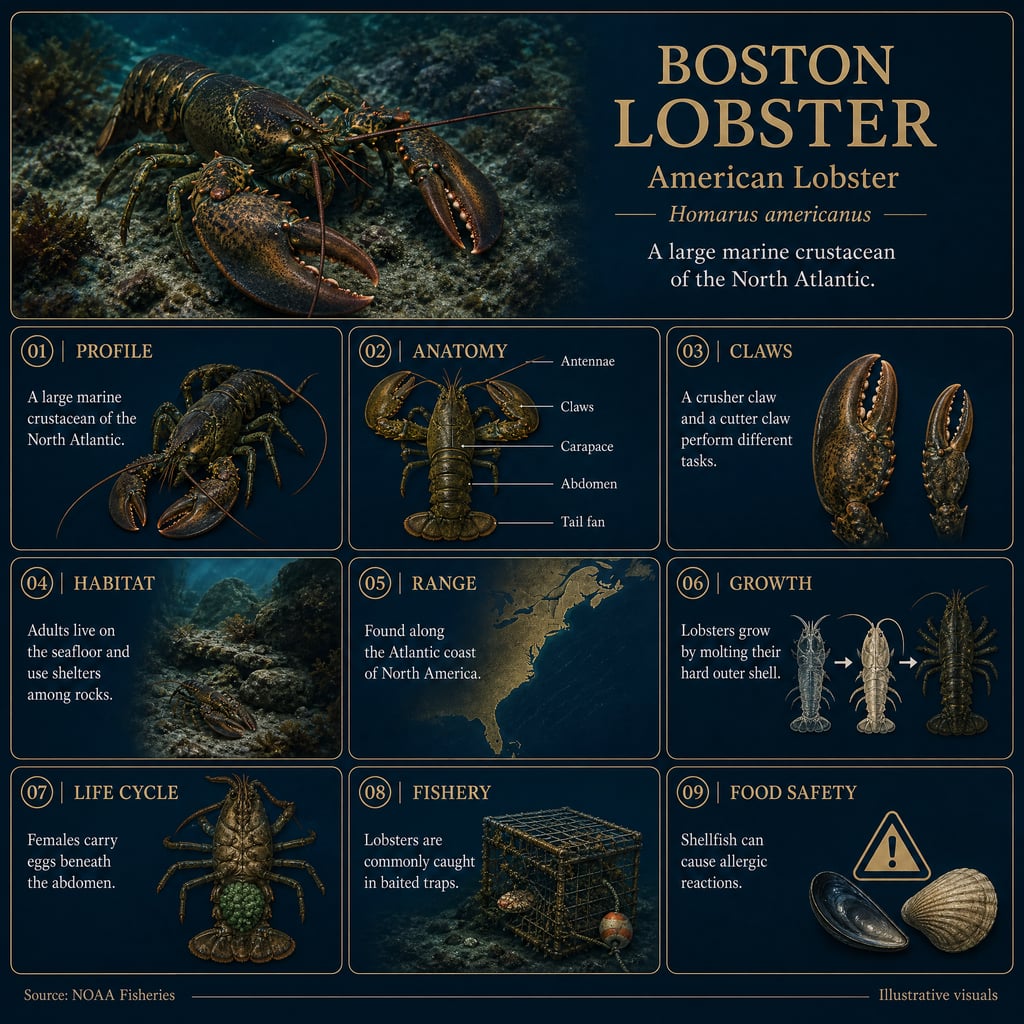
Guide Infographic Maker
infographics instantly
Guide Infographic Maker
infographics instantly
Showcase
Description
This skill creates accurate natural‑history field‑guide style infographics. It covers anatomy, botany, nutrition, wildlife, geography and lifestyle‑improvement themes. Following museum‑plate visual language with cream archival paper texture, restrained earth‑tone palette and strict grid layout, it assembles 6‑9 fact‑checked knowledge modules. It strictly forbids fabricating statistics or scientific claims. Output ready‑to‑use infographic visuals or complete generation prompts, ideal for educational sharing and editorial content creation.
Recommended by
Dancang
Why we love this skill
Transforms almost any educational topic into a collectible museum-style infographic, combining verified facts, clear visual storytelling, and editorial structure. Its standout strength is adapting diagrams, comparisons, practical guidance, and safeguards to the subject without padding or fabricating detail.
Best for
Educators, learners, and editorial content creators who need accurate, visually structured educational infographics.
How to use this Skill
Provide your input
Provide a topic, with an optional aspect ratio, audience, platform, reference image, or preference for a prompt-only result.
Run the Skill
The skill organizes the topic into a structured field-guide infographic and checks available facts for accuracy, consistency, and clarity.
Review your result
Receive a ready-to-use infographic visual or a complete, copy-ready English image-generation prompt.
Related Skills
View all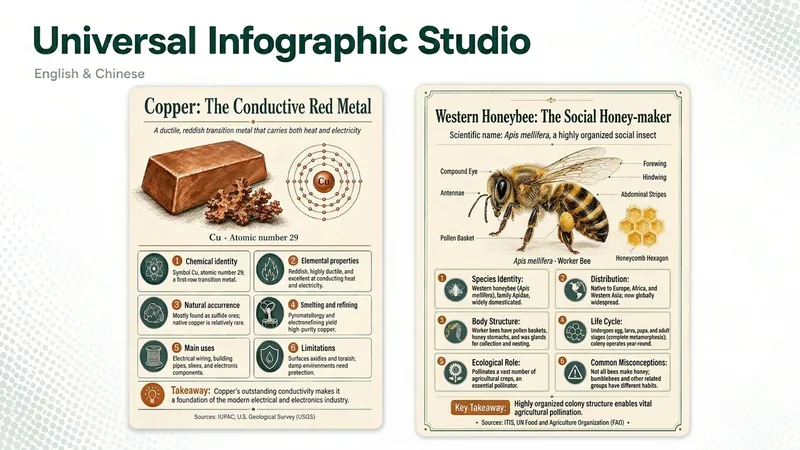 Image
Universal Infographic Studio
Universal Infographic Studio turns a topic — or material you supply — into one clear, structured knowledge infographic. Give it a subject, or paste a document, article, or image you want explained; it returns a finished infographic image, the exact on-image text in copyable form, and the sources it used. It works in English and Chinese, follows the language of your topic, and defaults to a museum field-guide look in a single 3:4 poster with four to six knowledge modules. Figures such as percentages and rankings appear with their context, and every point is checked before it is drawn. When image generation is unavailable, you receive a complete render prompt instead. Turn a topic, article, document, or image you provide into one clear, structured knowledge infographic. Give it a subject or source material to receive a finished infographic, copyable text from the image, and the sources actually used. It supports English and Chinese, follows the language of the topic by default, and uses a museum field-guide style in a single 3:4 image with four to six knowledge modules. Figures such as percentages and rankings are labeled with their context, and every key point is checked before rendering. If image generation is unavailable, it returns a complete render prompt. AI-generated text, data, and illustrations should be reviewed before publication. AI-generated text, data, and illustrations still require human review before publication.
 Image
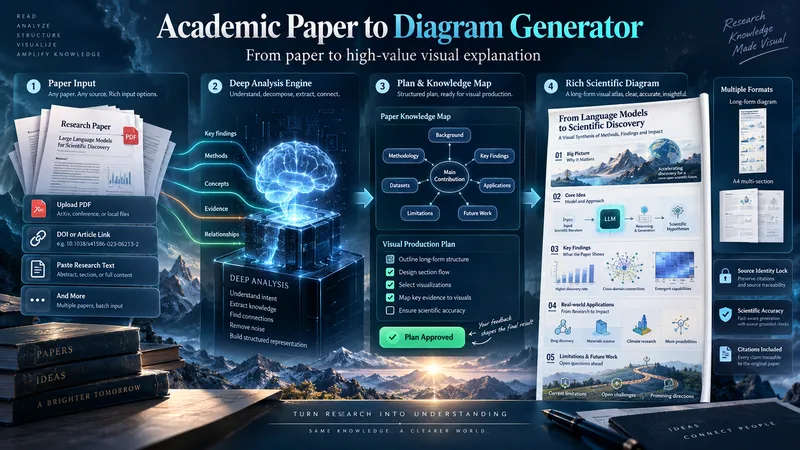
Academic Paper to Diagram Generator
Transform academic papers into detailed, scientifically faithful visual diagrams. The skill deeply analyzes the paper, identifies its most valuable concepts, mechanisms, methods, findings, and relationships, then builds a visual plan with you before generation. Instead of forcing every paper into a small infographic, it can create long vertical diagrams, wide technical maps, multi-section visual explainers, or A4-ready 2–3 part layouts when needed. The visual style is adapted to the subject, with room for AI-driven creativity, scientific illustration, data integration, annotations, and topic-specific visual storytelling. You can start with a PDF, URL, DOI, pasted text, or a request to find a suitable paper. The diagram language is user-approved, the source identity is locked for accuracy, and the final image is generated only after you review the visual plan and production prompt.
 Image
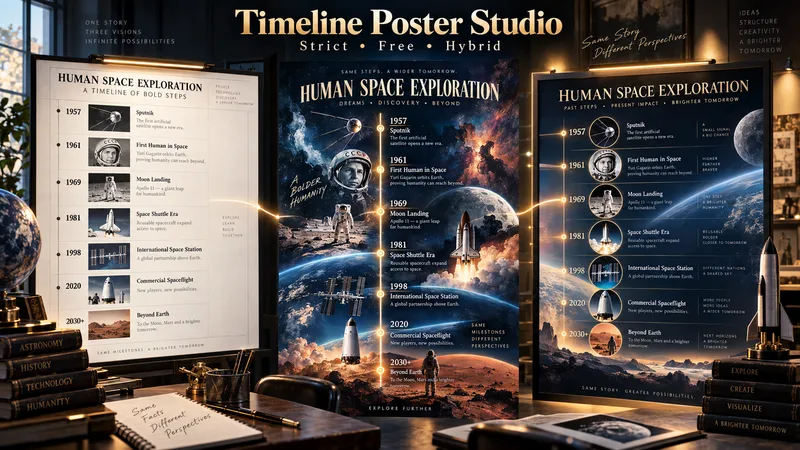
Timeline Poster Studio
Timeline Poster Studio transforms history, biography, technology, science, art, cultural change, product evolution, and other time-based subjects into informative and visually distinctive timeline posters. The skill first defines the topic, scope, audience, and time range, then performs focused research only to the level needed for the poster. It curates the most meaningful events, identifies turning points and natural eras, distinguishes exact, approximate, and duration-based events, and detects parallel storylines or geographic movement when relevant. It then builds an adaptive poster structure instead of forcing every topic into the same template or fixed aspect ratio. Depending on the content, the poster may use vertical, tall vertical, horizontal, or wide layouts. Visuals are selected according to their role: narrative scenes can blend naturally into the composition, while artworks, products, objects, documents, maps, and other reference visuals remain clearly organized and controlled. The design system protects chronology, readability, and factual structure while giving the visual AI creative freedom in color, typography, panel design, framing, decoration, background treatment, and overall art direction. For the same verified content, the skill produces three complete standalone poster prompts: Strict Hierarchical Design — optimized for educational clarity and structured reading. Free / Expressive Design — gives the visual AI greater freedom to create a bold and distinctive poster identity. Hybrid Design — balances clear information design with creative visual character. The prompts are designed to work across different image-generation tools, allowing the user to review, modify, or choose a design direction before generating the final poster.
Information
- Version
- v2
- Last updated
- Runtime credits
- Usage-based
- Models
- Auto
- Use cases
- Writing & contentImages & designLearning & education
- What you get
- ImagePrompt
- Visual styles
- EditorialPhotorealistic