Research Data Custom Plotting
Create highly customized charts for research
Research Data Custom Plotting
Create highly customized charts for research
Showcase
Description
Transform research and statistical data into clear, customizable professional charts using Matplotlib, perfect for papers, reports, presentations, and data analysis in Jupyter Notebooks. Whether you need time series, trend relationships, categorical comparisons, data distributions, matrix heatmaps, contour plots, or 3D visualizations, you can choose the right presentation method based on your data characteristics. You can finely adjust colors, line styles, markers, axes, legends, annotations, fonts, and layouts to create single or multi-panel composite figures while maintaining clear labels, harmonious layouts, and friendly color palettes. For complex scientific graphics, you also get clearer layer and coordinate control for ongoing modifications and code reuse. Generated charts can be exported in formats like PNG, PDF, and SVG for screen display or high-resolution publication, while also supporting animations, interactive environments, 3D graphics, and collaboration with common Python data tools like NumPy, Pandas, and Seaborn.
Best for
Ideal for researchers, analysts, and students who need to organize research or statistical data into charts for papers, reports, or presentations.
How to use this Skill
Provide your input
Provide research or statistical data, and specify the chart type, labels, color scheme, layout, export format, or other customization requirements.
Run the Skill
Selects the appropriate Matplotlib chart based on data characteristics, adjusts axes, legends, annotations, and layout, and generates reusable plotting results.
Review your result
Receive clear, customizable research charts, plotting code, and exportable PNG, PDF, or SVG files.
Related Skills
View all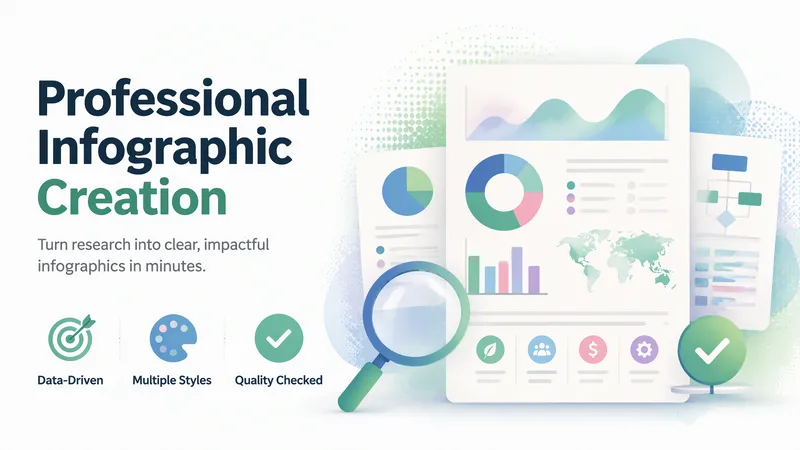
Professional Infographic Maker
Quickly transform complex information, data, and ideas into clear, professional, publication-ready infographics. Simply describe your topic, content, and purpose to generate visual outputs suitable for reports, marketing materials, presentations, internal documents, and social media without requiring any design experience. It supports common formats such as data visualizations, timelines, flowcharts, comparison charts, list summaries, geographic distributions, hierarchical structures, resumes, and social media graphics. It also matches visual styles to scenarios like enterprise, healthcare, technology, education, finance, and environmental protection. You can choose color schemes tailored to different audiences, including accessible palettes that are easier to read and considerate of color vision deficiencies. For content like market trends, industry statistics, scientific and medical information, or recent events, it can combine real-time research to supplement facts, figures, and background, helping reduce outdated or unsupported information. The generated results undergo quality checks focusing on layout hierarchy, text readability, data expression, color contrast, and overall communication effectiveness, with necessary optimizations for the use case. It is ideal for creating business report charts, product comparisons, project milestones, how-to guides, and social media content.
 Image
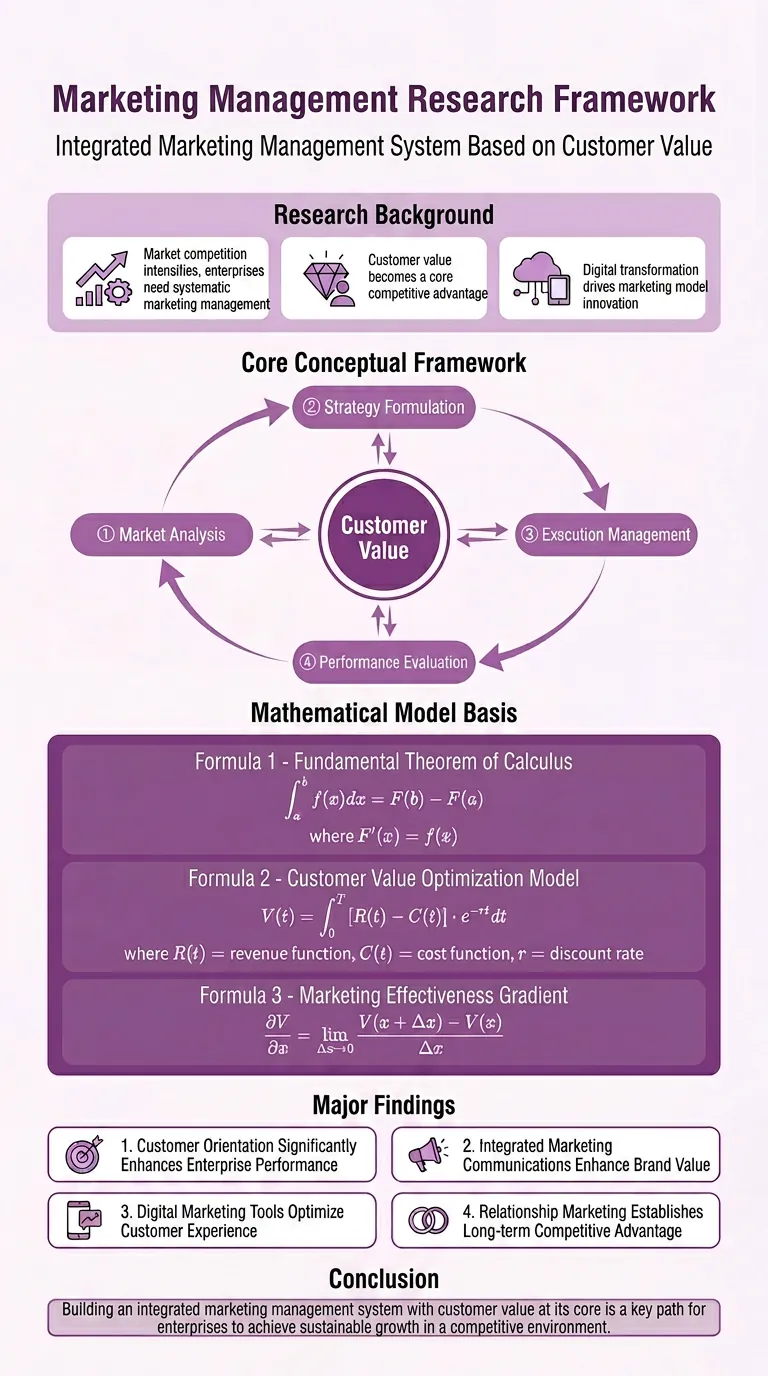
Research Paper Infographic
Easily transform your scientific research paper content into professional, high-definition academic infographics. Supports 18 mainstream types, making complex research results clear at a glance. Whether showcasing core mechanisms, experimental workflows, or creating graphical abstracts and technical roadmaps, this tool delivers precise results. We understand the rigor required in scientific illustrations, so beyond visual appeal, we prioritize scientific accuracy to ensure every image is clear and free of misleading information. You can directly provide the full paper, key sections, or a research description, and select the most suitable graph type, such as intracellular mechanism diagrams, tumor immune microenvironment diagrams, material catalysis mechanism diagrams, etc. We also offer a variety of color schemes like blue-green, orange, purple, and chart structure styles like left-label and vertical flow, making your infographics both academically compliant and professionally aesthetic. Beyond traditional academic graph types, this tool also supports 15 creative templates for scientific visualization scenarios, helping you turn research concepts into unique visual works such as magazine-quality posters, interface breakdowns, app design boards, etc., suitable for group meetings, social media, or report covers. We provide a strict controllability checklist and a three-step verification process, and support partial modifications to generated images, ensuring every step closely matches your needs, presenting your research results in the most intuitive and accurate way.
 Image
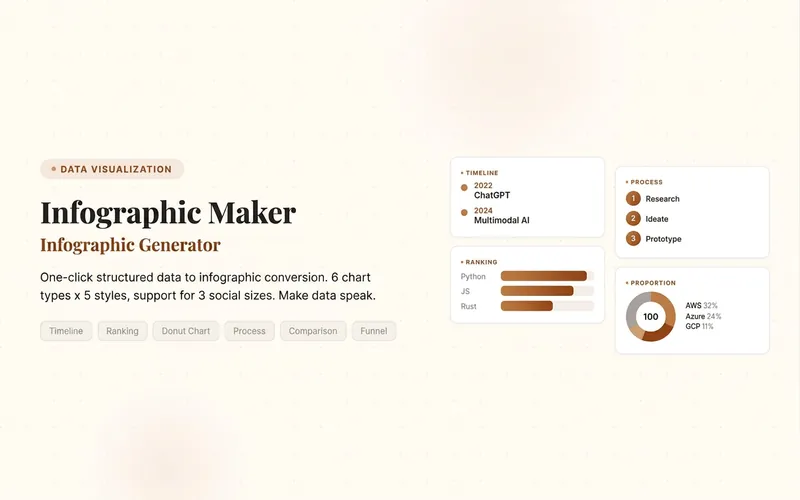
Infographic Maker
Easily turn any article, table, link, or casual note into a professional infographic, making your data and insights stand out. Whether it's a single poster or a multi-page carousel, this tool intelligently identifies content structure and automatically extracts key information—no manual formatting required. Choose from six chart types: timeline, flowchart, ranking, proportion, comparison, or funnel, and pair them with visual styles like Business Blue, Creative Color, Dark Tech, Elegant Warm, Minimalist Black & White, or Xiaohongshu-exclusive styles. We specially support Chinese content and brand colors to ensure visuals are both professional and aligned with your brand identity. Whether for annual reports, social media (e.g., Xiaohongshu, Instagram, X), or study notes, this tool generates high-resolution PNG images in multiple sizes, helping your information spread in the most appealing way. Say goodbye to tedious design work—create stunning infographics with one click, letting data speak and stories come alive. Companion tools: For final drafts to be published on WeChat Official Accounts, look for '公众号排版器'; for data tables needing publication-grade formatting, look for 'TableCraft'; for quote card sets, look for '知识卡片生成工坊'.
Information
- Version
- v2
- Last updated
- Runtime credits
- Usage-based
- Models
- Auto
- Use cases
- Images & designPresentations & reportingResearch & analysis
- What you get
- ImageCode